- Search Energy EXCH
- 77 Results
- Twiitch replied Nov 22, 2011
just for the record — many good lucks to ppl learning here... you'll need it... don't get to caught up here on gurus...do your own research and analysis on what you see in the chart. I don't get in FF much at all any more...I look at a couple ...
vsa with Malcolm
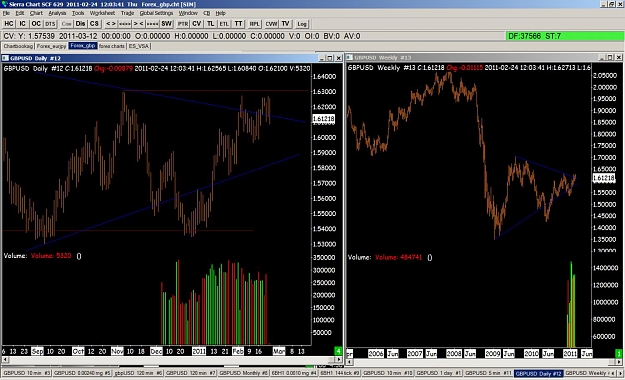
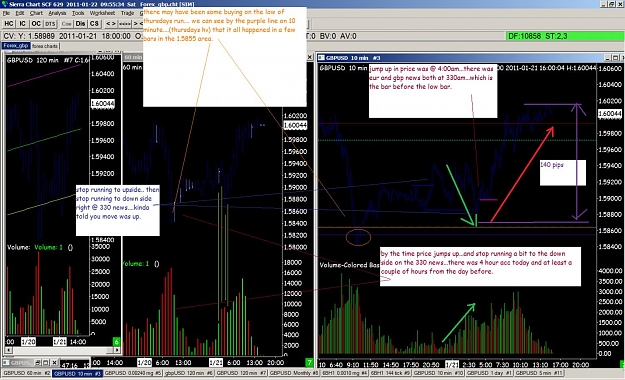
- Twiitch replied Feb 24, 2011
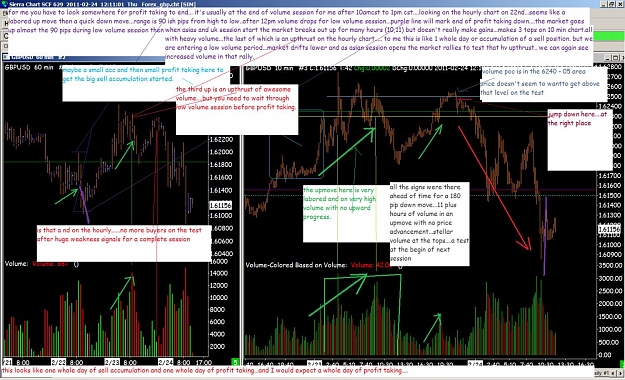
example of GU — the fast 100 pip plus down moves tell me when profit taking is ending...give me a starting place for next low volume session and an accumulation.....it takes time to acc a position..if you can see that before trading. you have ...
herds_sheep_lemmings - and nothing more!
- Twiitch replied Feb 24, 2011
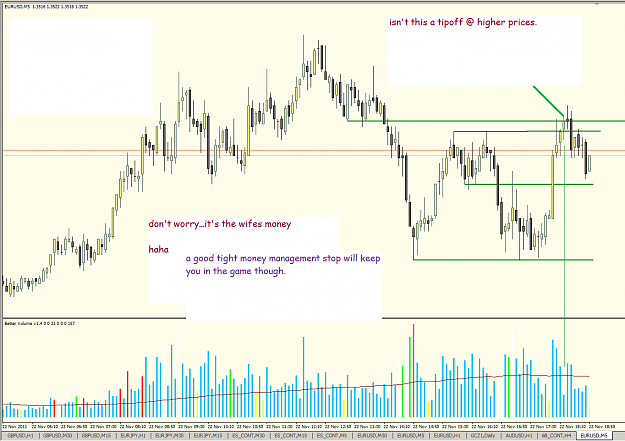
V.S.A. and this — Hey Marcus... as for last week it looked like huge support in the 1.6 area for GU. a rally off that support is not that hard to see. I don't really see a trend in GU right now.. it's in a large triangle and range bound I ...
herds_sheep_lemmings - and nothing more!
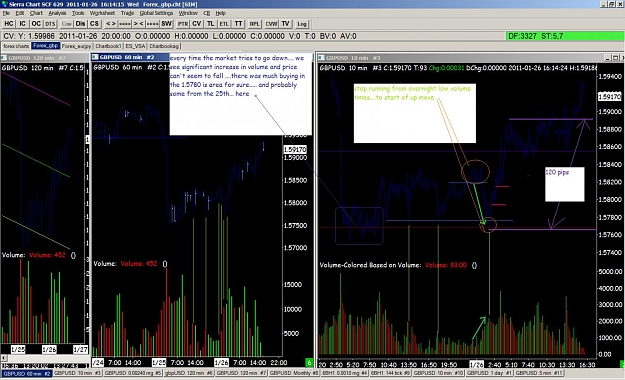
- Twiitch replied Jan 26, 2011
double top — somehow a double...double top
herds_sheep_lemmings - and nothing more!
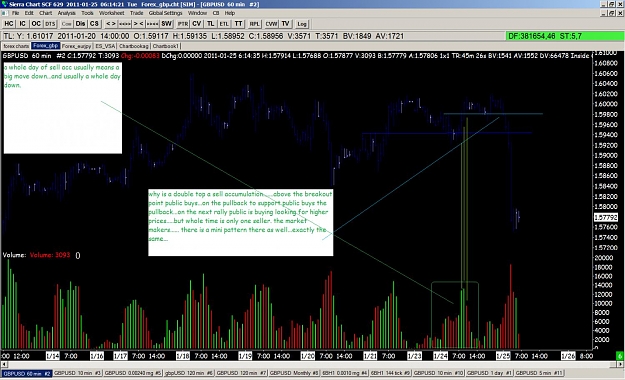
- Twiitch replied Jan 25, 2011
accumulationthenprofittaking — same but different
herds_sheep_lemmings - and nothing more!
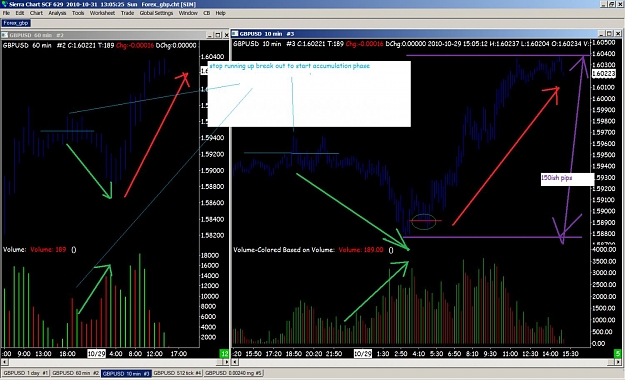
- Twiitch replied Oct 31, 2010
new charts to look at . — image accumulation then profit taking.
herds_sheep_lemmings - and nothing more!
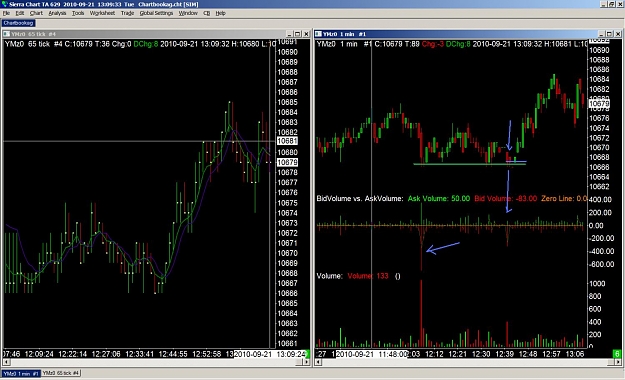
- Twiitch replied Sep 21, 2010
no play for me...so saggyway with ym post hehe — I am just simply sitting out A I did long ym earlier for a few pips from 10668 and should held for more! the high volume on and heavy bid hitting smells of the market makers buying the ...
vsa with Malcolm
- Twiitch replied Sep 13, 2010
In reference to Richard Ney books — the markets go through never ending cycles of accumulation of a buy or sell position then profit taking. in general, ref. to Ney books. we as retail traders are trading against those that run the markets. ...
vsa with Malcolm
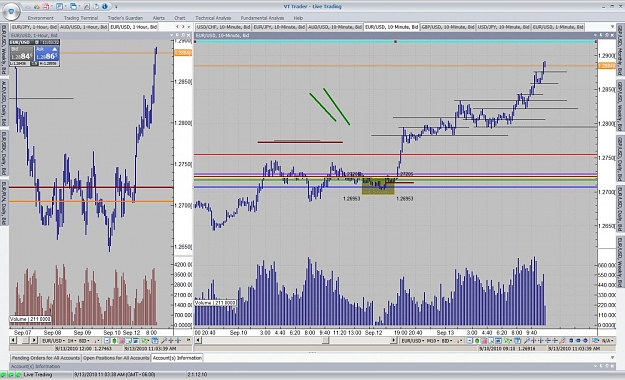
- Twiitch replied Sep 13, 2010
eurusd has been in up move profit taking all day — and it can always go higher. the eurusd has been profit taking all morning...UP the gu and eu are out of sync I would be cautious for sure. generally, if a pair is profit taking into new high ...
vsa with Malcolm
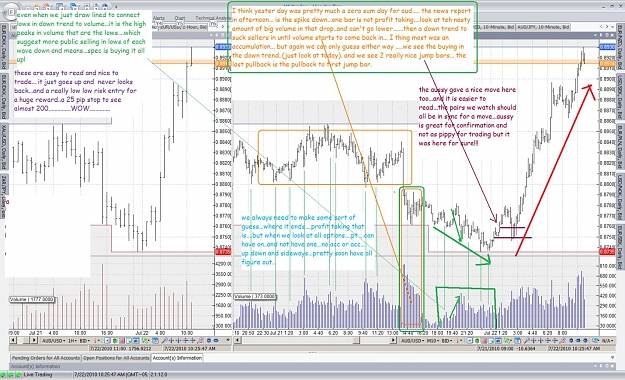
- Twiitch replied Jul 25, 2010
a nice chart to look at! — nice colors to look at on the chart too.
herds_sheep_lemmings - and nothing more!
- Twiitch replied Jul 21, 2010
double down — previous day down...today down too! end of previous day is distribution...
herds_sheep_lemmings - and nothing more!
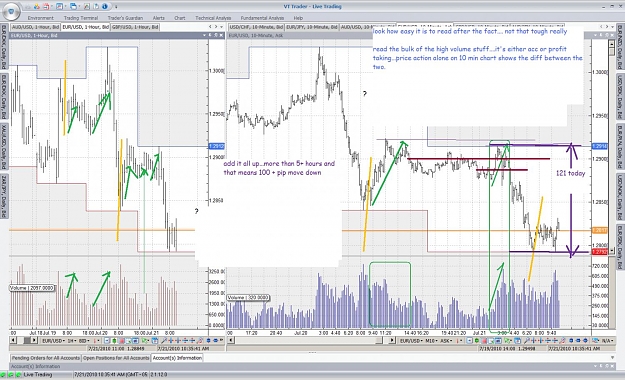
- Twiitch replied Jul 20, 2010
EURUSD Chart — the eurusd this am distribution at previous highs
herds_sheep_lemmings - and nothing more!
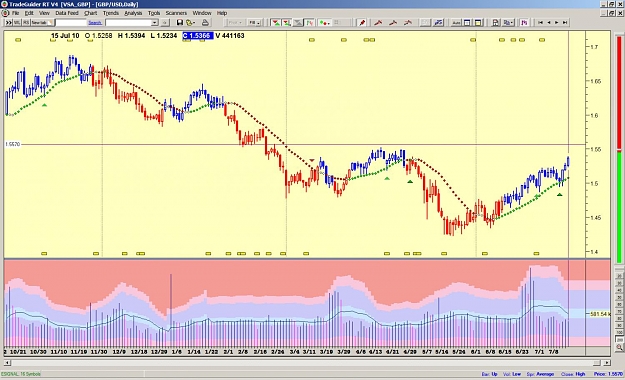
- Twiitch replied Jul 15, 2010
Realtimedata chart — here is realtimedata...chart on gu daily
vsa with Malcolm
- Twiitch replied Jul 9, 2010
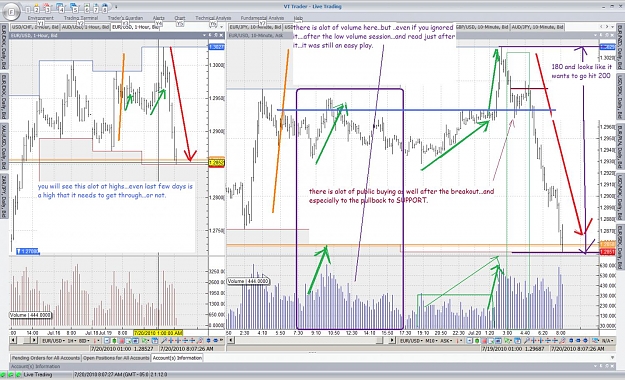
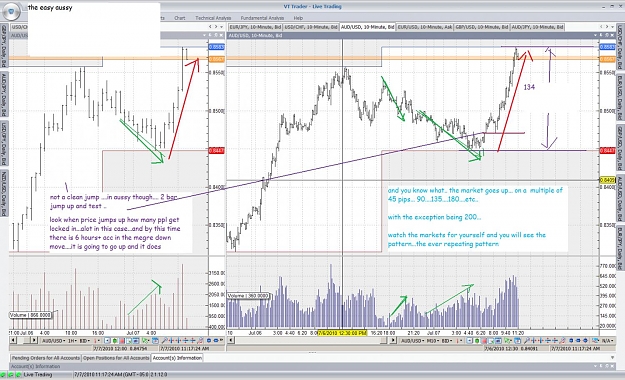
the easy aussy .. — audusd chart
herds_sheep_lemmings - and nothing more!
- Twiitch replied Jul 5, 2010
Hey guys .... wassup — we need more charts to show what you guys are talking @ with trades setups.....when I go through all these posts... I find that my mouse finger is sore from flipping back and forth through posts and charts trying to ...
vsa with Malcolm
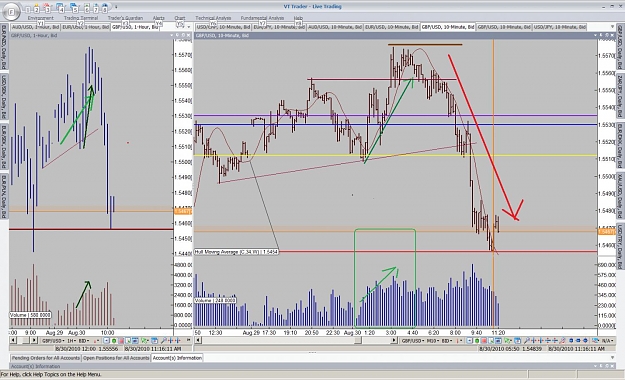
- Twiitch replied Jul 1, 2010
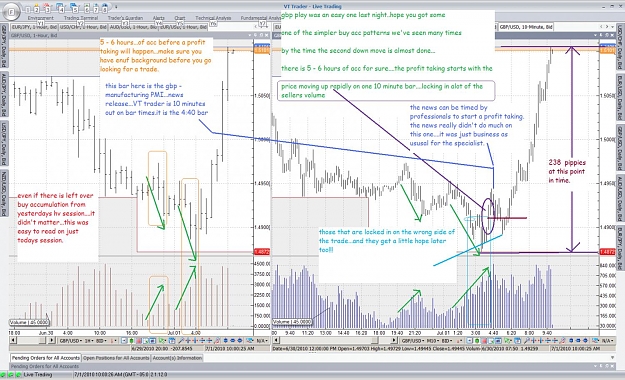
GBP ... manufacturing PMI — 1. wait to see enuf acc after a profit taking 2. this is gonna be at least 5 hours 3. start looking for an entry after 2. has been met 4. watch ppl get locked in wrong.... 5. look for a nice entry....cuz you now ...
herds_sheep_lemmings - and nothing more!
- Twiitch replied Jun 29, 2010
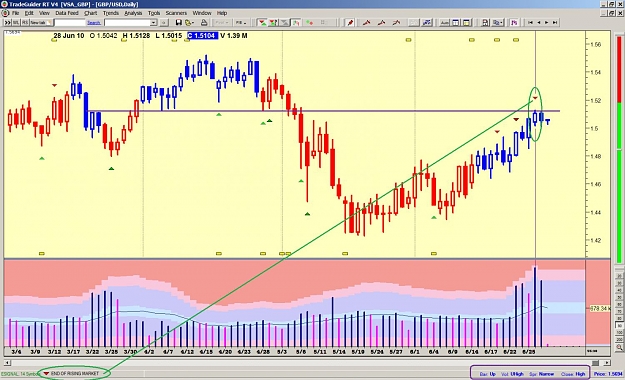
Just a look @ gbpusd daily — it looks bearish....a little! this is eod from realtimedata....does anyone else show the same volume/ indication?
vsa with Malcolm
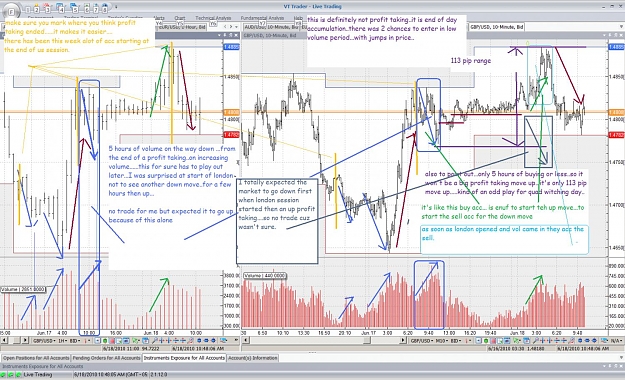
- Twiitch replied Jun 18, 2010
Long term view on gbp makes sense on reading short term — not sure if this view on gu makes any sense on how it's manipulated. short accumulation made sense when we look at long term picture...GBP had to get up to the channel resistence ...
herds_sheep_lemmings - and nothing more!
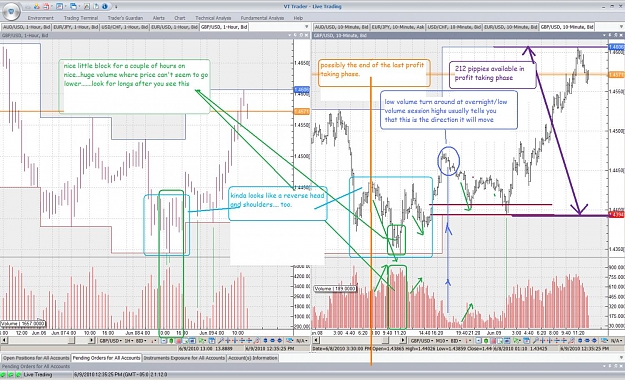
- Twiitch replied Jun 9, 2010
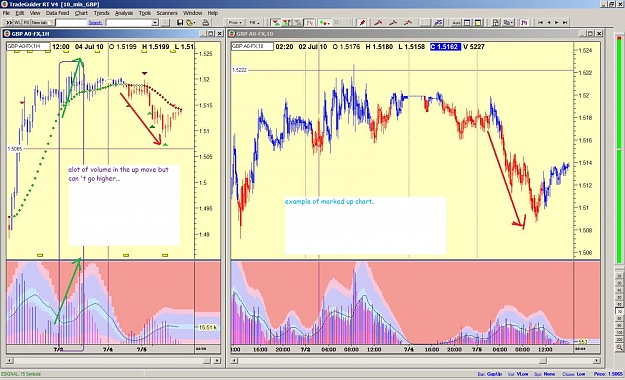
gbp...today and yesterday — lots of pretty colors on chart to look at too!
herds_sheep_lemmings - and nothing more!