- Search Energy EXCH
- 11 Results
- TimMorge replied Jun 23, 2009
Here's an easier way to trade this move: Market Structure. I know my friend spouting religion and system trading statistics won't 'get' this either, but it was 'falling off a log'. Just finished my live pre-market session and this was one of the ...
Andrews Pitchfork (Median Line)
- TimMorge replied Jun 18, 2009
Great posts, guys! Maybe we'll get an active thread going here yet! Note the two attempts to claw above the 38.2 area. The forks look good, the structure looks IFFY. I don't think price has played its big card yet--and is that big card a buy or ...
Andrews Pitchfork (Median Line)
- TimMorge replied May 29, 2009
Important lesson on keeping your emotions in check. Start each day with a fresh mind and let the market where it is going THAT day and for the next XX minutes. Keep your mind free from opinions and trade what the market gives you! People that got ...
Andrews Pitchfork (Median Line)
- TimMorge replied May 29, 2009
Last portfolio update: My 10 year old son has been helping me update my hand drawn charts since last summer. He nailed the turn down in crude when gas was $4.25 a gallon in Chicago--his call was that we'd see $1.50 a gallon gas within six months! ...
Andrews Pitchfork (Median Line)
- TimMorge replied May 29, 2009
Still long Nov Beans. I have already locked in profits on 2/3's of the position and it looks so good, I am scared its about to go vertically higher! I don't see a logical profit area, so I'll just let what's left run with a stop under prior swing ...
Andrews Pitchfork (Median Line)
- TimMorge replied May 29, 2009
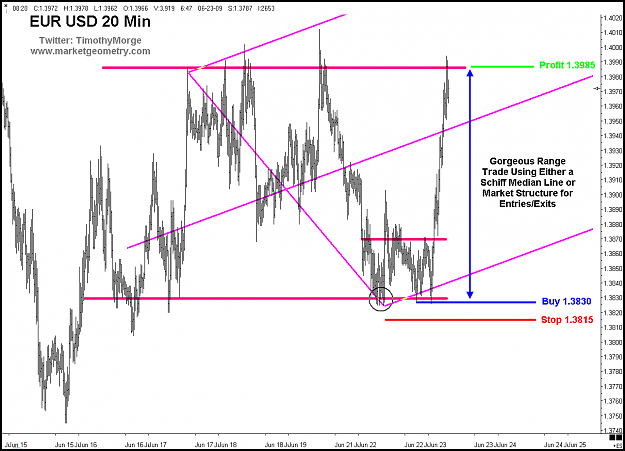
Another classic set up, this time in EURUSD. Again, using a simple test and re-test on an up sloping Median Line set with a high probability set up that has a small stop loss. Note that the profit area is at an Energy Point, where Lines of Opposing ...
Andrews Pitchfork (Median Line)
- TimMorge replied May 29, 2009
Here's a gorgeous CADUSD set up I pointed out earlier and twittered on stocktwits. CADUSD is in vertical mode again, so the game is to find quality entries after major pullbacks that give a change in behavior. This is my favorite set up, a test and ...
Andrews Pitchfork (Median Line)
- TimMorge replied May 26, 2009
GBPJPY 240 min — It isn't that surpising that the GBPJPY 240 chart looks a bit like the GBPCHF 240 min chart. Testing prior Major Swing highs, may still end up being a range, but no sign of weakness yet. I like how the 'slop' above and below ...
Andrews Pitchfork (Median Line)
- TimMorge replied May 26, 2009
GPBCHF 240 min Bars — Good afternoon. This still looks like a range to me,and price took out the prior Major Swing High, so until I see a sign of major weakness, I would not be a seller. I see the trendline you added in, but so far, it is ...
Andrews Pitchfork (Median Line)
- TimMorge replied May 26, 2009
Interesting place to attempt a long in the Eur against the USD if this is a pullback in a strong uptrend--Although that may have been the pullback, we'll see. I wish you all good trading. Timothy Morge
Andrews Pitchfork (Median Line)
- TimMorge replied May 26, 2009
AUD 240 Min Bar Potential Entry — Here's an interesting place to attempt a long in a pullback in the longer term up trend in the AUD with a relatively small stop, given 240 min bars. We'll see if the market let's me--and then turns or flushes ...
Andrews Pitchfork (Median Line)
- Posts by Member Search: 'TimMorge'