- Search Energy EXCH
- 8 Results
-
 Tenshi28 replied Feb 26, 2010
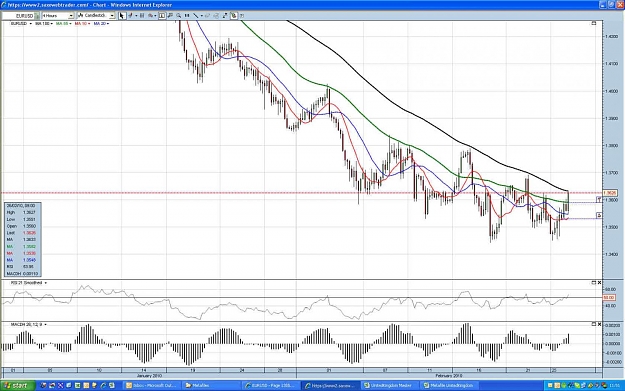
My take: Looking at the H4 chart EURUSD has been contained by the MA55 and the MA100 all throughout the downward channel started at 1.44. If it breaks the MA100 decisively, and given the pin bar on the daily charts yesterday, I think it goes up to ...
EURUSD
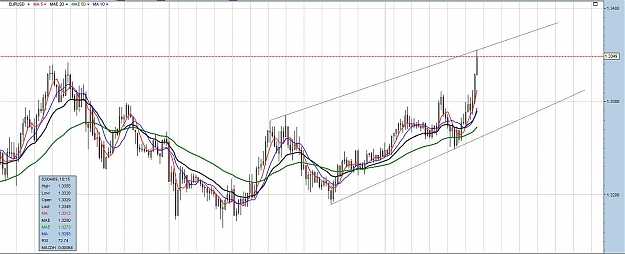
- Tenshi28 replied Apr 22, 2009
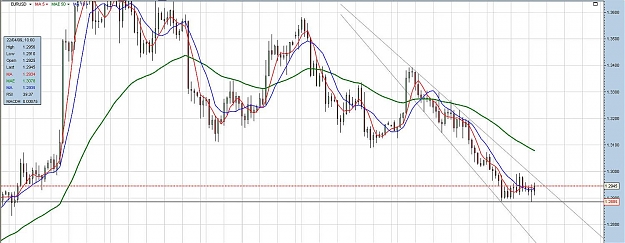
My take: if price definitely breaks the 1.2885 then we're going down big time for now. However, a breach of the upper band of this downward channel may prompt a solid retrace, with 1.31 on sight to begin with.
EURUSD
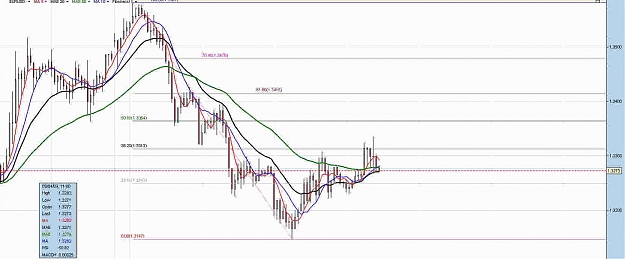
- Tenshi28 replied Apr 14, 2009
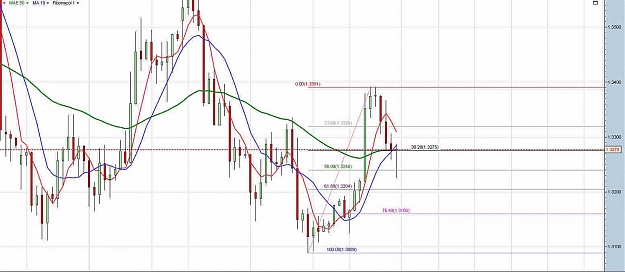
This is my current setup: Waiting to see if price closes H4 bar above 1.3275 (38.2% retracement from 1.3089 to 1.3391), which incidentally is just above the 50MA, and to top it, it would be a hammer. In case it does, I am going in long.
EURUSD
- Tenshi28 replied Apr 14, 2009
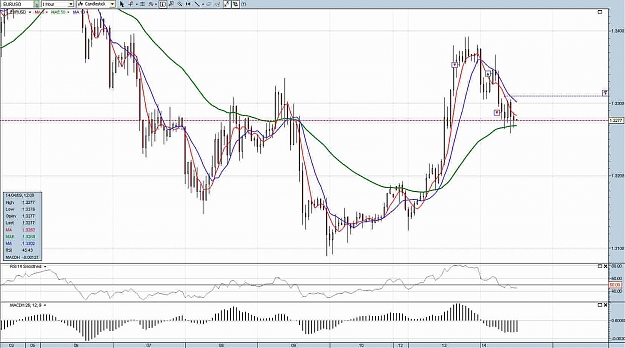
I am watching the H1 and my take is this: if price can make a clean break below the 50MA, then it should go down to 1.32 and possibly below.
EURUSD
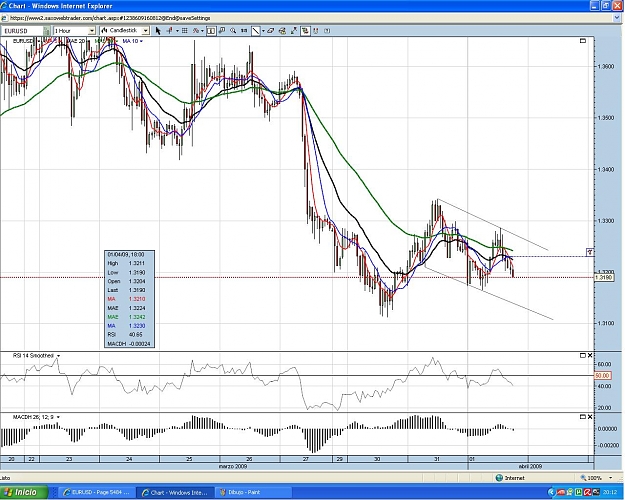
- Tenshi28 replied Apr 9, 2009
In the H1 chart, price seems to have made a pretty solid rebound off the 38.2 fibo level. Pointing to drop towards 1.32 and below?
EURUSD
- Tenshi28 replied Apr 1, 2009
Price seems to be moving almost to the pip through this downward channel.
EURUSD
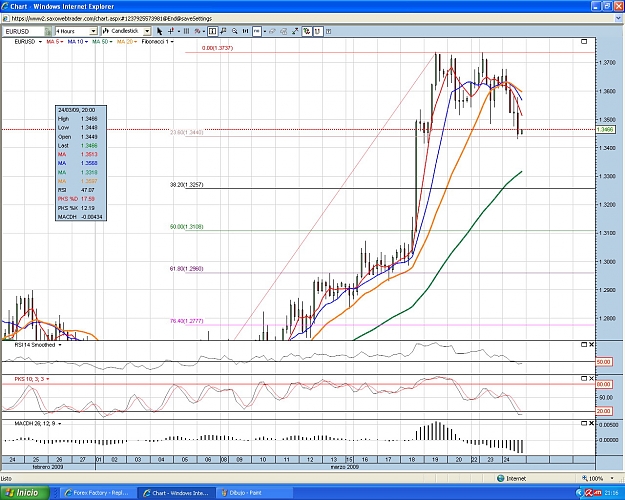
- Tenshi28 replied Mar 24, 2009
Anybody sees this as a fibonacci retreatment from the 1.3737 high in the 4h chart, with a first bounce at the 0.236 level (1.3440)?
EURUSD
- Posts by Member Search: 'Tenshi28'