- Search Energy EXCH
- 23 Results
- StoppedOut replied Jan 24, 2024
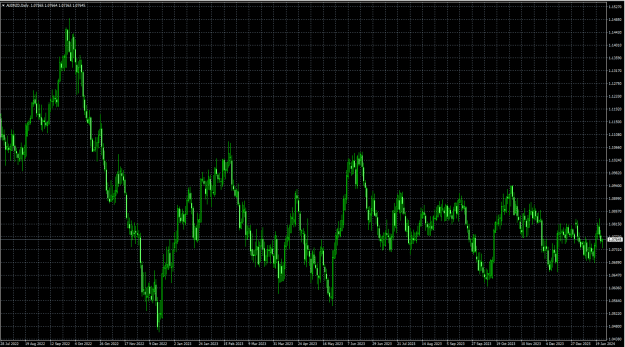
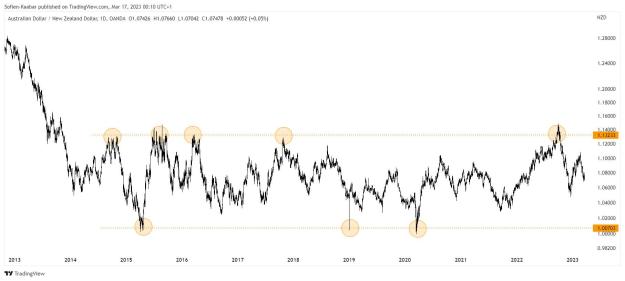
So guys., how have you been able to trade this multi month range on the pair. quite frankly if you have made profit trading this pair you trully have a working system and stick to it.
AUDNZD
 ...
...
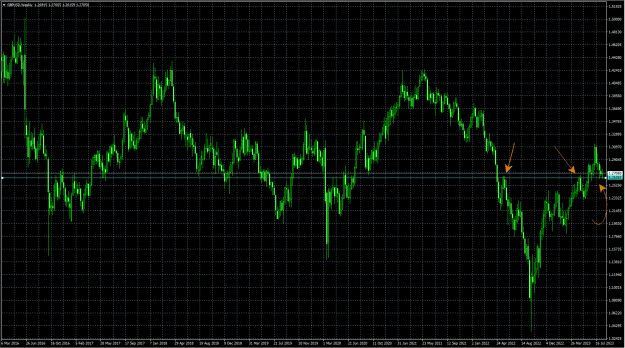
- StoppedOut replied Aug 17, 2023
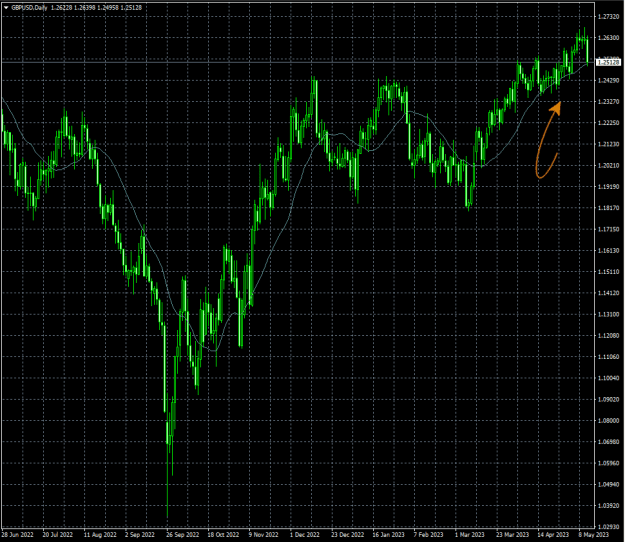
Cable seems to have found support at the 1.2635 level. this is great for bulls and am sure they are very keen to hold price above this price level.see pic image
Cable Update (GBPUSD)
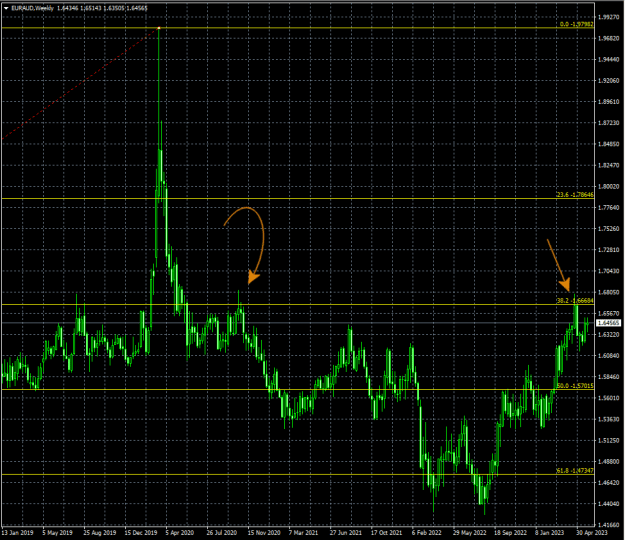
- StoppedOut replied May 31, 2023
Its hard to resist shorting this pair at current price level. It worked the first time, will it work the second time? image
EUR/AUD
- StoppedOut replied May 11, 2023
How price is respecting the cadet blue line is quite magical. Fun times ahead for the bulls.note the line was once resistance but now bulls have converted it to provide support. image
Cable Update (GBPUSD)
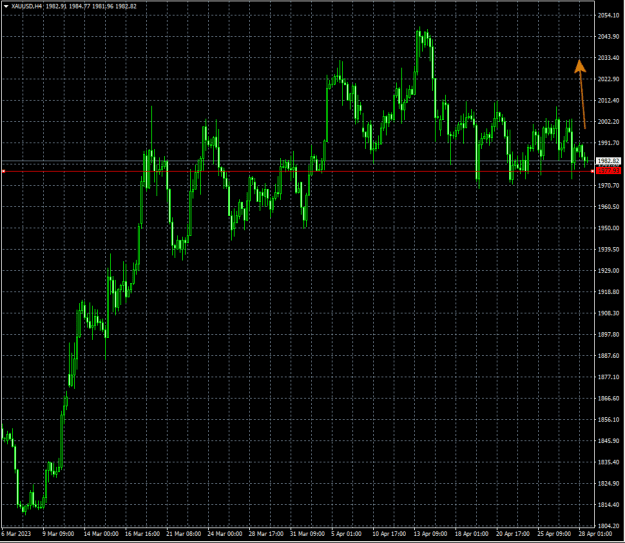
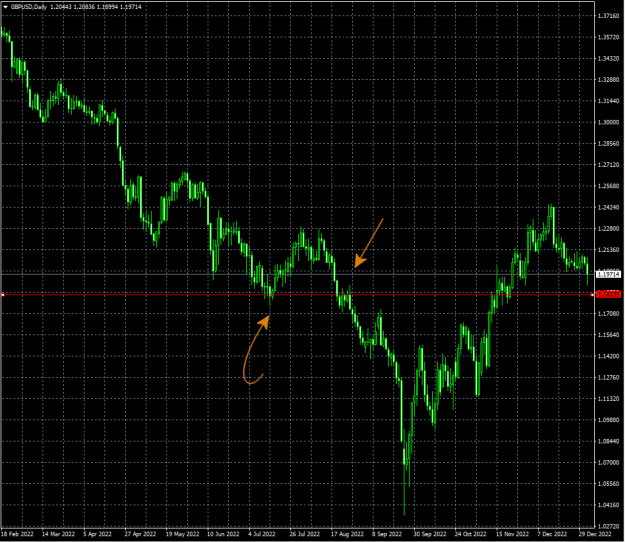
- StoppedOut replied Apr 28, 2023
Bulls are still incharge of the price here until they break the red line (support) in the chart.If you want to get a good position to ride the ride up then a buy limit at the support is ideal. image
Gold
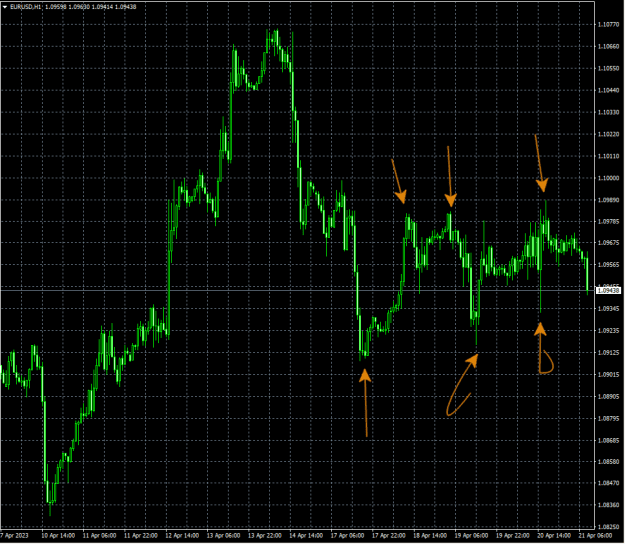
- StoppedOut replied Apr 21, 2023
The currency is extremely bullish making higher highs and higher lows donot be fooled by the "ranging" on the daily chart. until we break .0931 the bulls have a hold on the price.See chart below image
EURUSD
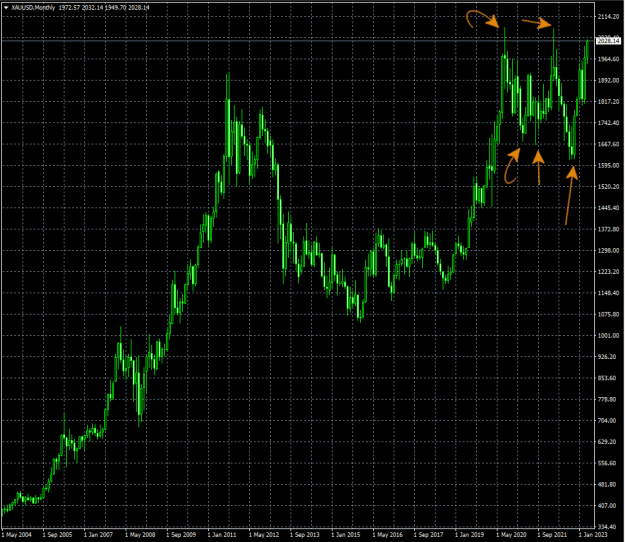
- StoppedOut replied Apr 13, 2023
I know there are many gold traders here but going forward be cautious with your long trades.As you see on the monthly chart the price has been making lower highs and loser lows.So if the price failed to break past the last lower high at 2070.41 then ...
Gold
- StoppedOut replied Mar 20, 2023
well price cooperate this time and i am in to ride the retracement. Its a reracement not a bottom as per the screenshot below image
AUDNZD
- StoppedOut replied Mar 3, 2023
am sure support and resistance traders are over the moon right now. Three (3) good instances price has found support image
Cable Update (GBPUSD)
- StoppedOut replied Feb 28, 2023
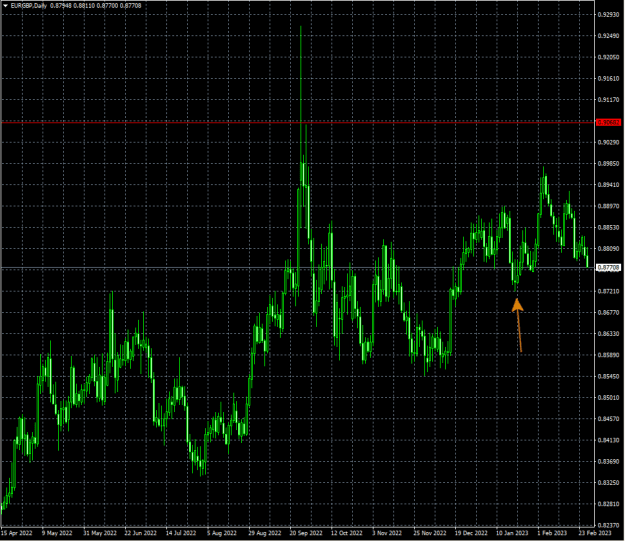
Just alerting you that we are back to the buy region at .8721 shown by the orange arrow. Its also the last swing low in the up move.An ideal trade setup is to look for longs around this region and they target the red line sitting at .9068 .See pic ...
EURGBP only
- StoppedOut replied Jan 3, 2023
watch out for that support level at 1.1833 . donot get too over bearish. But itsnot a place to buy just yet image
Cable Update (GBPUSD)
- StoppedOut replied Dec 30, 2022
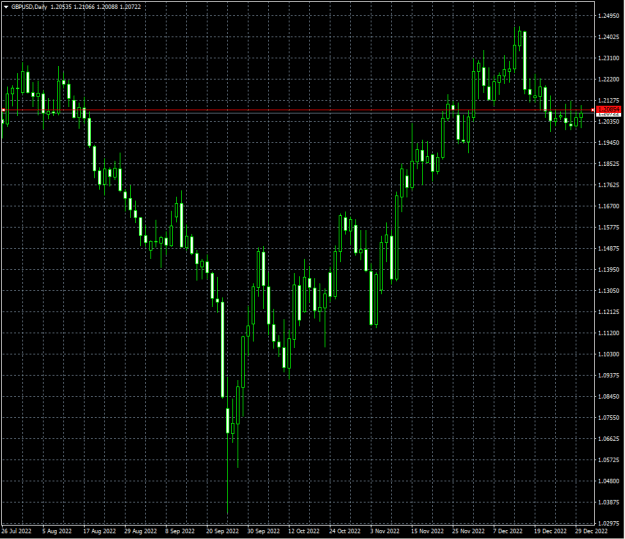
I love how price is being capped below the 1.2085 mark. If you are bullish you should definitely cut that bullishness by 1/2 image
Cable Update (GBPUSD)
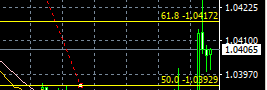
- StoppedOut replied Nov 30, 2022
Anybodyelse concerned about the failure of the pair to breakout of 61.8% level? I can hear bears rubbing their bands very hard at the back there. image
EURUSD

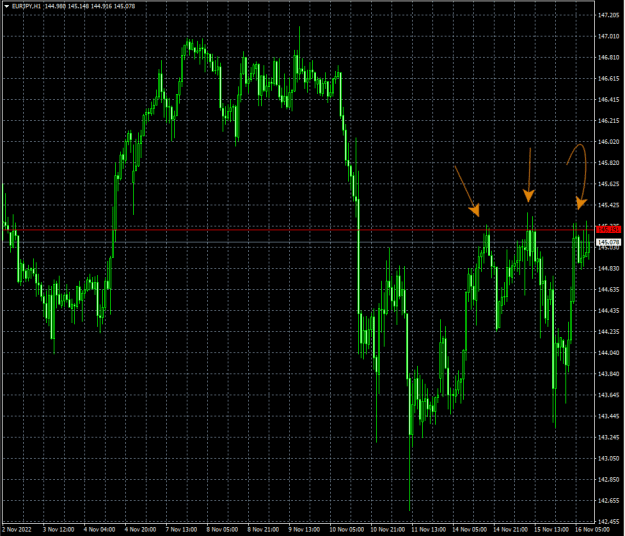
- StoppedOut replied Nov 16, 2022
A potential and powerful TRIPPLE top is developing on eur/jpy. The overall trend is down so this provides a nice entry for trend continuation. image
EUR/JPY Only
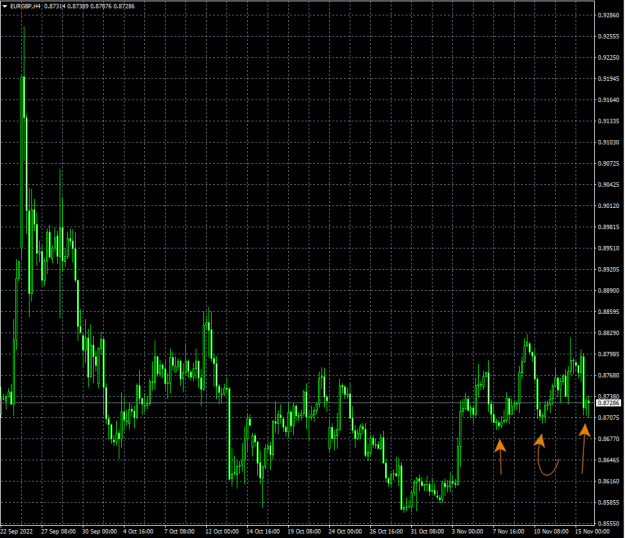
- StoppedOut replied Nov 15, 2022
EUR/GBP printing higher highs before tomorrow's cpi data! Well, that's a no brainier trade. image
No Brainer Trades
- StoppedOut replied Nov 14, 2022
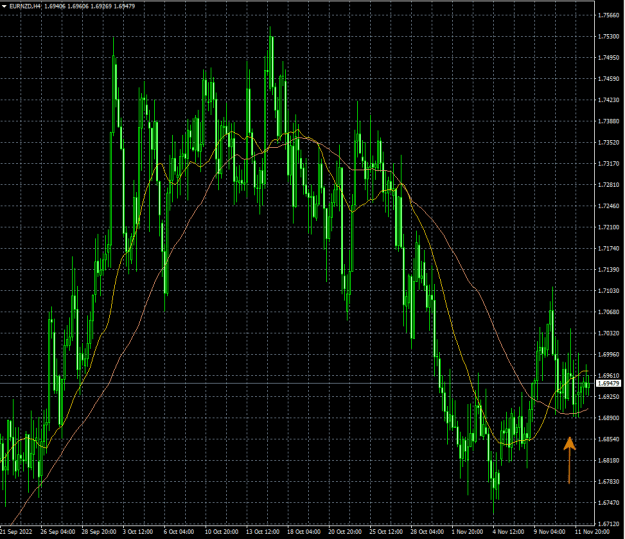
and that my friend its what is called price indecision.the breakout will have ALOT of momentum image
EURNZD
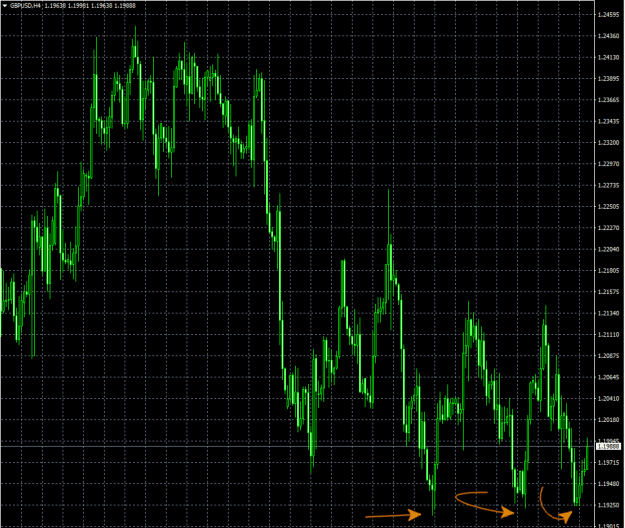
- StoppedOut replied Nov 13, 2022
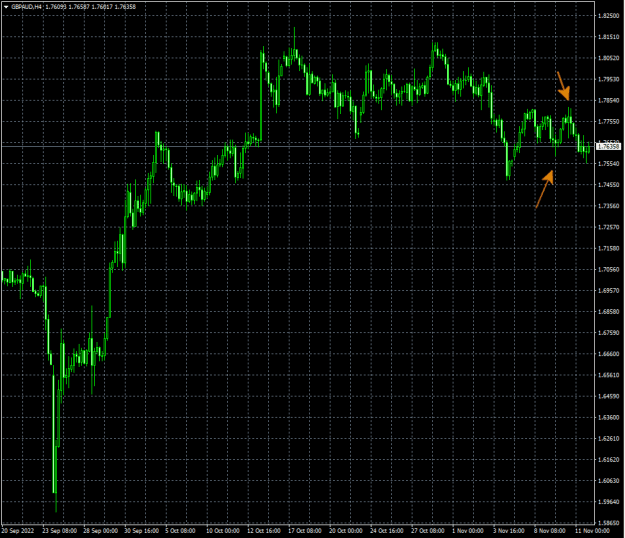
i spot a nice choh (change of character) on the 4 hour chart.The price broke the highest high and also broke the lowest low as indicated by the arrows.I do expect a rally toward the high but not taking it out thus confirming the down trend is the ...
GBP/AUD
- StoppedOut replied Nov 11, 2022
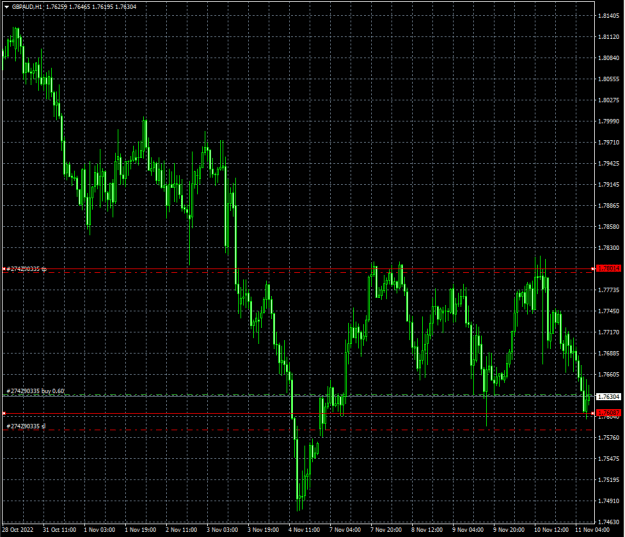
gbp/aud is currently ranging and providing very easy pips.Consider entering long image
Only Live Trades
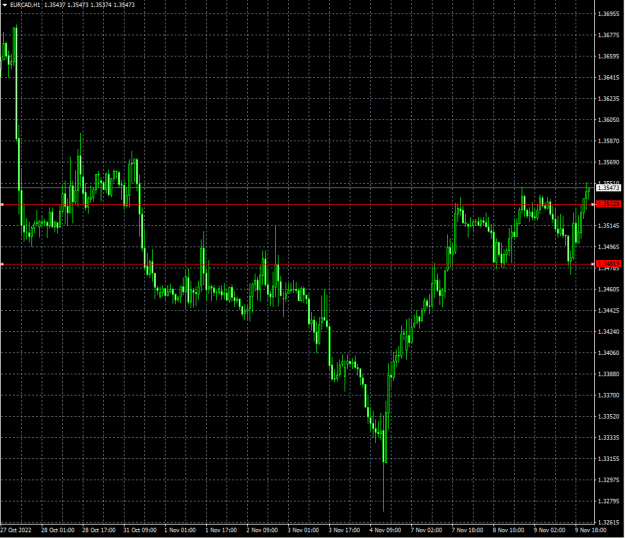
- StoppedOut replied Nov 9, 2022
there's a successful breakout to the upside on the pair.prepare your long positions.Time frame is 1 hour. The target is your own choice,but donot be too greedy.
EUR/CAD