- Search Energy EXCH
- 46 Results
- Sossos replied Jan 13, 2021
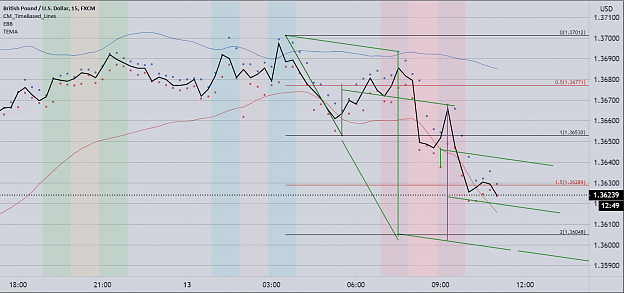
image While I have spent time in the same places as Winston, I am finding that the GBP/USD is measured best on the mountains and valleys without extended lines (per the picture). Tying in Hidden Gaps question, I got short around 1.36800 expecting ...
(binned per thread starter’s request) Supply and Demand, Price
- Sossos replied Oct 28, 2018
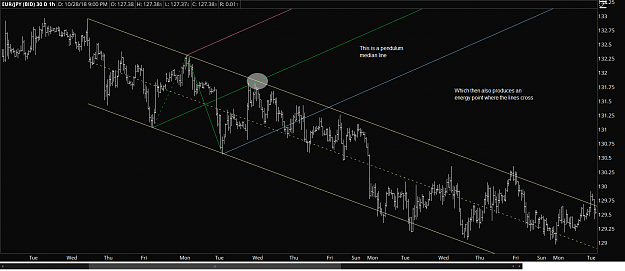
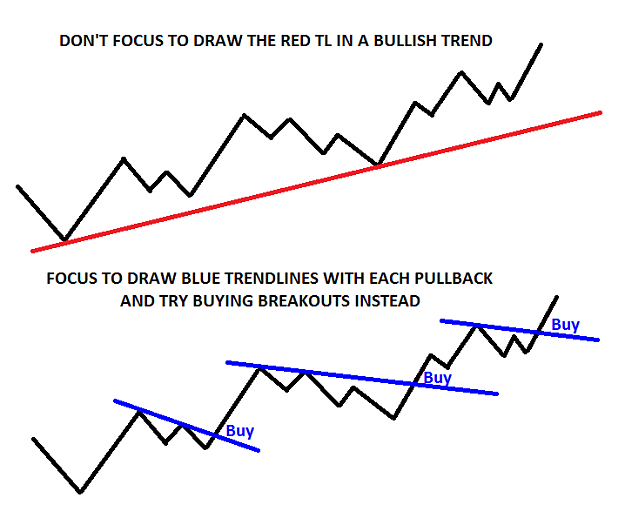
A pendulum line would be a median line set that looks for each pullback in a trend.
The One: Price Action and Reaction
- Sossos replied Oct 27, 2018
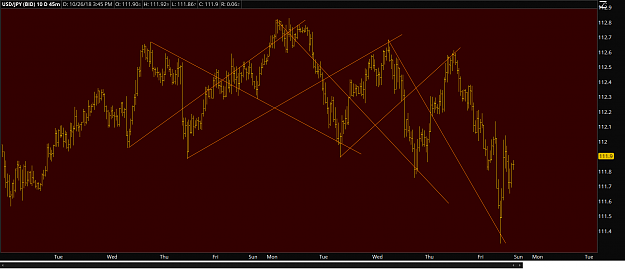
Just to go beyond the basic median line work to show the importance of unaltered price action. I will share a chart with last weeks hidden lines. Sometimes the gaps or frequency sticks out like a dogs balls, other times it doesn't. This is the U/J ...
The One: Price Action and Reaction
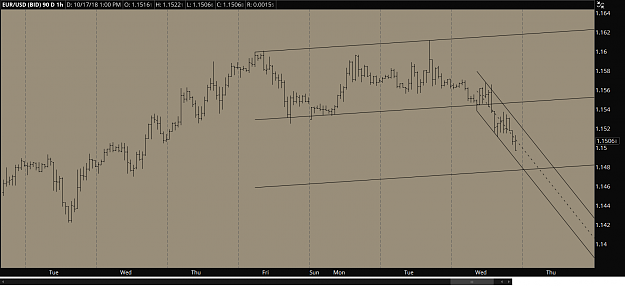
- Sossos replied Oct 17, 2018
My current view of things. 1 hour chart
The One: Price Action and Reaction
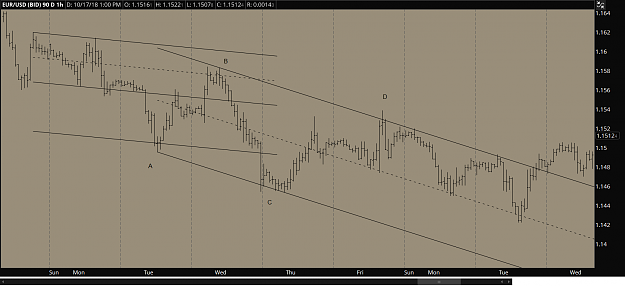
- Sossos replied Oct 17, 2018
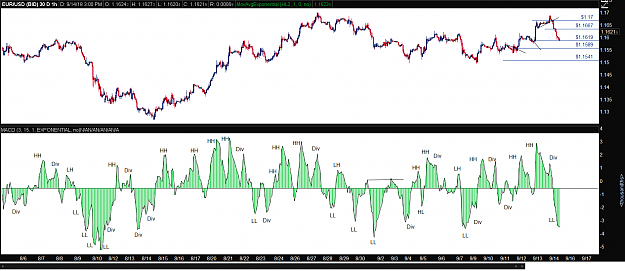
Just to stick my nose into others business. One of the things that markets do often is create same sized retracements thru the course of a swing. One of the challenges of using the median lines is that which one to use where. My preference is to use ...
The One: Price Action and Reaction
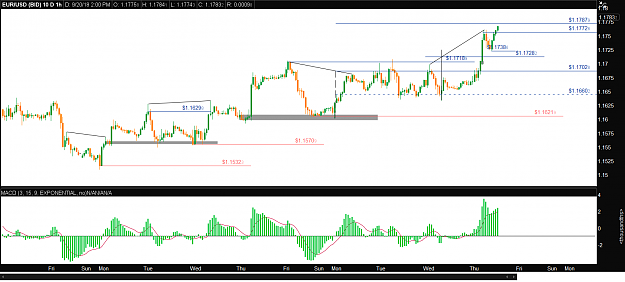
- Sossos replied Sep 20, 2018
I have a Magnetic line at 1.17879 along with the divergence.
EURUSD only
- Sossos replied Sep 17, 2018
Forgot this one Edit, took me most of the day to find these particular posts
EURUSD only


- Sossos replied Sep 16, 2018
They can recreate it by doing the work. It's an hourly chart and I followed the standards (roughly) that Ata has shown in the thread. The other thing that I do is I make copies of the important pictures that he posts. Then I can look at them at my ...
EURUSD only
- Sossos replied Sep 15, 2018
In the process of learning Ata's methods ( KiwiOz , Demark) this is the way I have to do it. I need to prove it to myself. I have gone back 30 days drawing the lines, which the majority of the lines drawn are cloned (1st thing learned). I see how to ...
EURUSD only
- Sossos replied Sep 12, 2018
Don, consider for a second that he might know something that you don't. This is the trouble with learning. People don't know what they don't know. How can they? Try to imagine that he may not be sharing every bit of experience and knowledge with the ...
EURUSD only
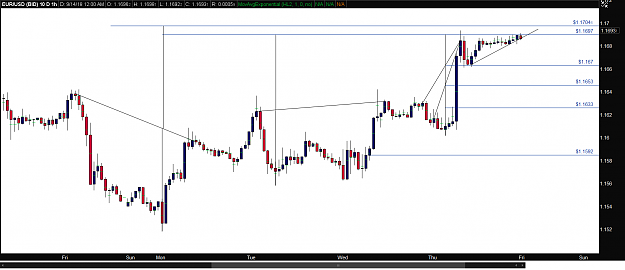
- Sossos replied Sep 12, 2018
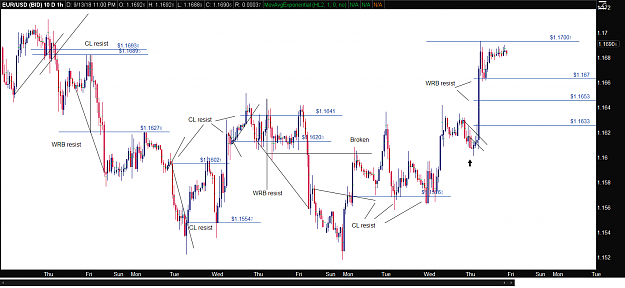
Here is the picture I posted at 2:24. Now we need one more leg up.
EURUSD only
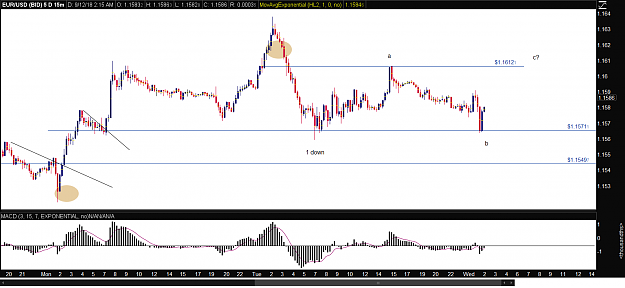
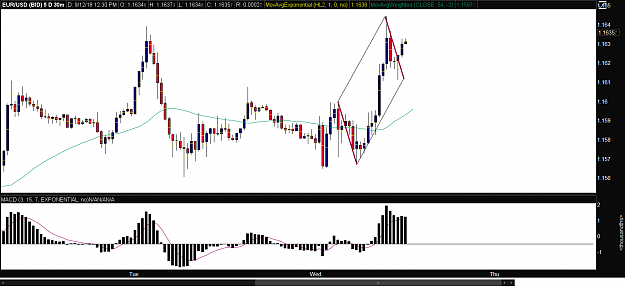
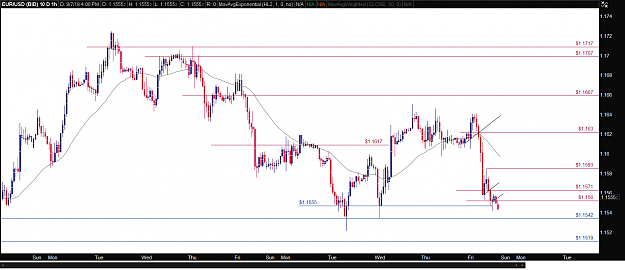
- Sossos replied Sep 12, 2018
See how the S/R points that mattered in the past, matter now. Whipsaw in action. Step back and look. This is a 15 minute chart. Three little legs up toward 1612 and the bulls will be in a froth.
EURUSD only

- Sossos replied Sep 10, 2018
Hey Coreg, I usually just look for 5 pivots. In an up market, 3 up - 2 down, a down market 3 down and 2 up. I trade within the context of those parameters. Generally I don't have to look back very far to find resistance or support areas to exit my ...
EURUSD only
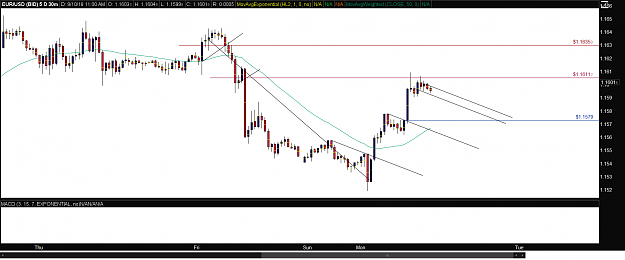
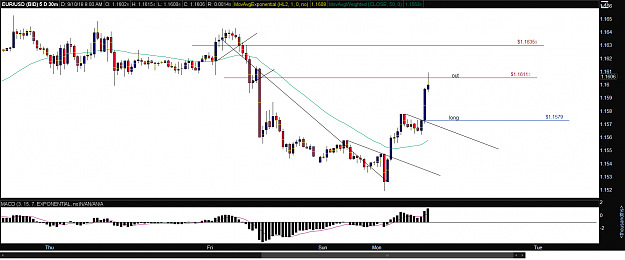
- Sossos replied Sep 9, 2018
As always the market will do what it does. One of the more reliable methods that I've seen to see or find levels is with Ata's cloned trend line breakout levels. They get retested often and usually quite precisely. (It's a clue when it gets sloppy). ...
EURUSD only
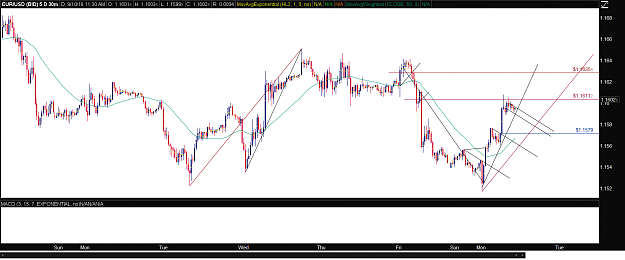
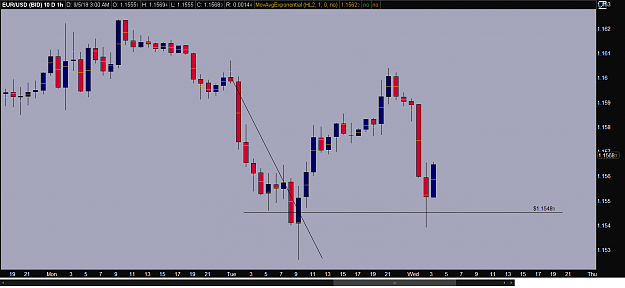
- Sossos replied Sep 5, 2018
Something like this. And I guess that would be considered support not resistance.
EURUSD only
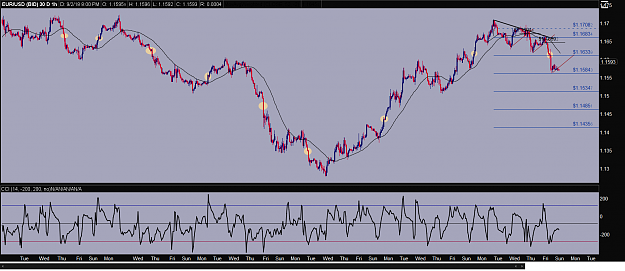
- Sossos replied Sep 2, 2018
All of the yellow circles are centers that are identifiable when they happen. I'm saying it's information staring back at us for us to use, if we just notice. What's the common denominators? It's like the market crosses a barrier and whoosh. Plus ...
EURUSD only