- Search Energy EXCH
- 40 Results
-
 Sedaka replied Jul 24, 2013
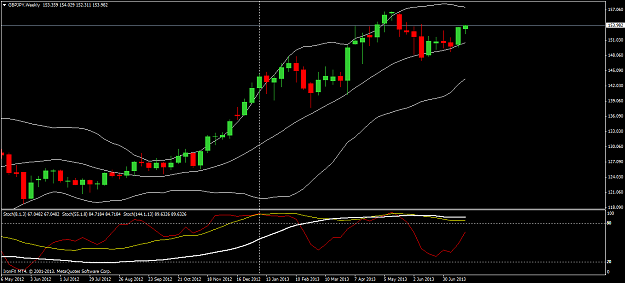
i'm prefer buying GJ since weekly's chart going to complete either Stoch(fast retrace back to 2 slows in parallel) or bb to the up side. image
Geppy's Geppy Thread (GBP/JPY)
- Sedaka replied Mar 26, 2013
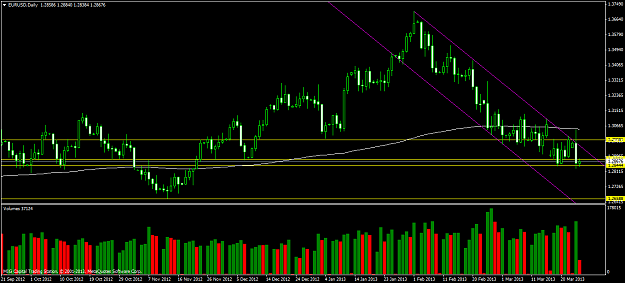
Looking at recent daily candles, we have more shadow on top compared to bottom. Channel showing a failure of breakout to go up for yesterday candle. Volume on bear candles higher than bull candles. IMO, trend will continue to go down to 1.2658.
EURUSD
- Sedaka replied Jun 23, 2011
My view. 2 long candles on daily down typically will be followed by short candle down tomorrow in order for price to go up next week.
Cable Update (GBPUSD)
- Sedaka replied May 3, 2010
Looking for some pips..hope it will touch upper band and UTL again...
Auslanco - GBP/JPY and GBP/USD (newstrade)
- Sedaka replied Apr 28, 2010
I'm expecting it to reach fib level at 78.6(1187.25) before retrace and not good to go short at the moment(Only scalping will do it). Above the said level then yum..yum...yum
Grashid- Gold Analysis
- Sedaka replied Apr 20, 2010
At the moment, a lack of volume to go up but for the last load before turn to go down except 1150.24 is breached .
Grashid- Gold Analysis
- Sedaka replied Apr 8, 2010
Unable to break 1.5128 where a lot of volumes(buyers/sellers). Are we going stay in the funnel and then break that to the north? Im remain bullish as long as it remain above 1.5128
Cable Update (GBPUSD)
- Sedaka replied Apr 2, 2010
My view for next week-Bearish bias — There is tweezer top on daily and hope today's close will be below last month close. 1st support is at 1.5107. Then she will continue down to close this week's daily gap at 1.4896.
Cable Update (GBPUSD)
- Sedaka replied Mar 18, 2010
Sooner or later we will heading to north either it go up first or retrace and then go up as below chart
Grashid- Gold Analysis
- Sedaka replied Mar 18, 2010
My chart — Hope to see cable ranging in yellow higlited area next week. My weekly fib still below 50.0 and my target is at 61.8(1.5740) and then retrace to form inverted H&S by continuing bullish.
Cable Update (GBPUSD)
- Sedaka replied Mar 17, 2010
Gu will touch the LTL and then bounce back continue bullish. On higher time(daily/weekly) frame still in bearish...
Cable Update (GBPUSD)
- Sedaka replied Mar 17, 2010
Hard to play with current situation...Will wait to sell at 1138/39 since there are still a spaces for gold to touch the lines
Grashid- Gold Analysis
- Sedaka replied Mar 5, 2010
Trade ur chart — gu 99% will go down at current price....
Cable Update (GBPUSD) I'll wait before enter long
- Sedaka replied Mar 4, 2010
Expected to move up at 1160.30 before a retracement due to lack of daily volumes for a past few days. No post at all until the level reached.
Grashid- Gold Analysis
- Sedaka replied Feb 26, 2010
my view for current trend are purposely for discussion only. down to 1105 area due to divergence(OsMA H1). And normally this divergence wouldnt last long and will retrace back continue uptrend due to lack of volume on tf H1. Maybe NY session we may ...
Grashid- Gold Analysis
- Sedaka replied Feb 24, 2010
Why buyers are so active...wait and see the big bear...
Cable Update (GBPUSD)
- Sedaka replied Feb 24, 2010
Base on my chart, if the price failed to breach 1105.54(blue line), we still in down trend.
Grashid- Gold Analysis
- Sedaka replied Feb 23, 2010
High volume on down trend at yellow circle highlited shown sellers are active now + the LTL and support at 1105.54 being breached and start to go down, however we will see a retracement later on if the divergence(H1 OsMA) work out. IMHO there will ...
Grashid- Gold Analysis