- Search Energy EXCH
- 51 Results
-
 Red Alert replied Jul 5, 2015
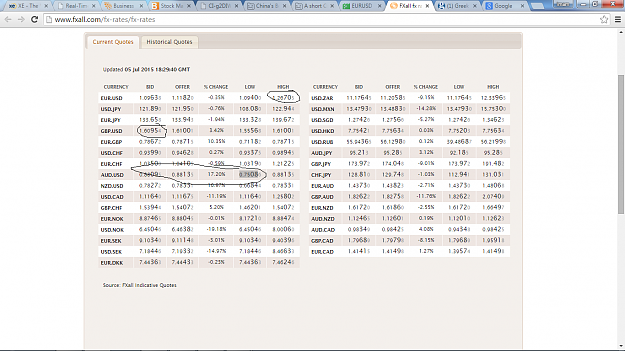
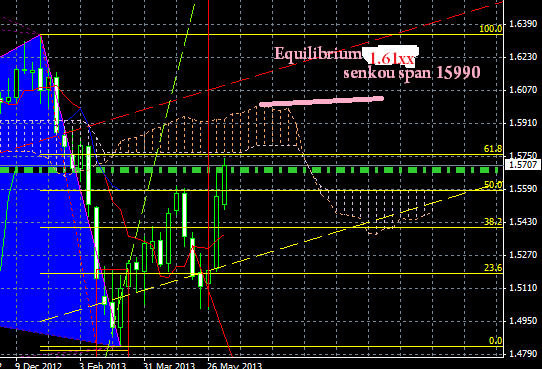
This is from url Look at GU and AU, AUDusd jump for 1000 pips (17%) and GU in 1.6xx area The highest range for EU is 1.2670 Sound weird to me, if this is correct the people who buy pounds and AUD should be very lucky
EURUSD
- Red Alert replied May 11, 2015
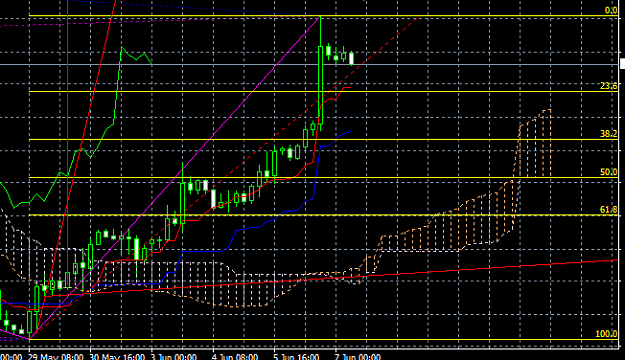
This is my vision, the chart will move to right direction not left....
Cable Update (GBPUSD)
- Red Alert replied Mar 9, 2015
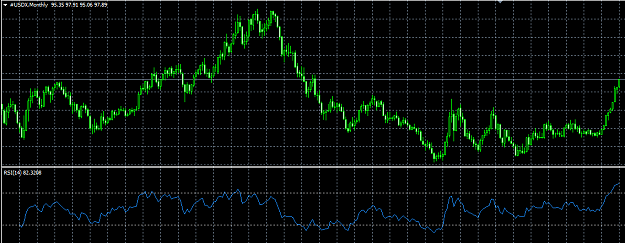
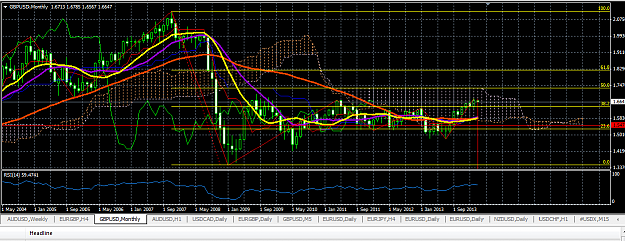
USD Strength indicated by Monthly RSI showing in the Chart (latest value USDX value 97.89), the RSI value is Highest since 1992...82.xxx, indicating overbought, but still the monthly candle printing bullish..I don't see any sign of reversal....still ...
Cable Update (GBPUSD)
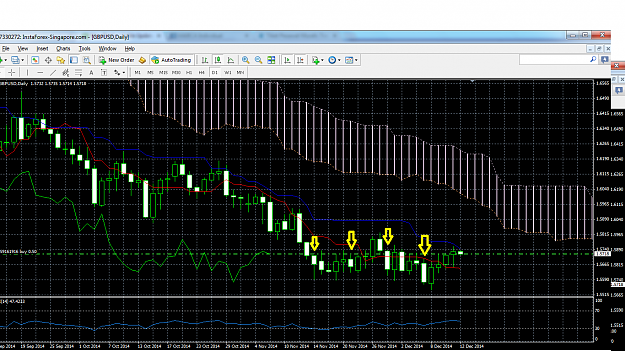
- Red Alert replied Dec 12, 2014
latest 4 friday was heavy sell day for cable.....I remember because I always buying,
Cable Update (GBPUSD) made me working really hard to recover.... What about today?
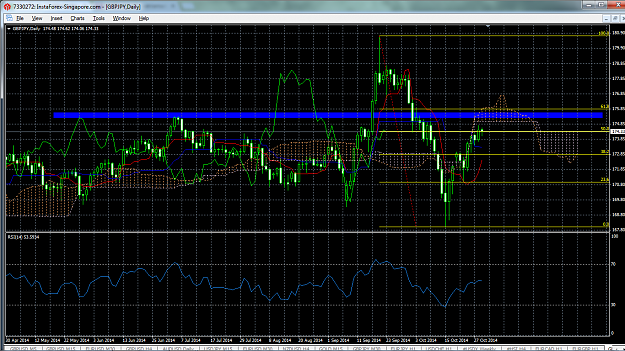
- Red Alert replied Oct 29, 2014
175.04 is big resistance in my chart, the price around 50% daily fibo...... still some space to next resistance, happy green mate Good luck
Cable Update (GBPUSD)
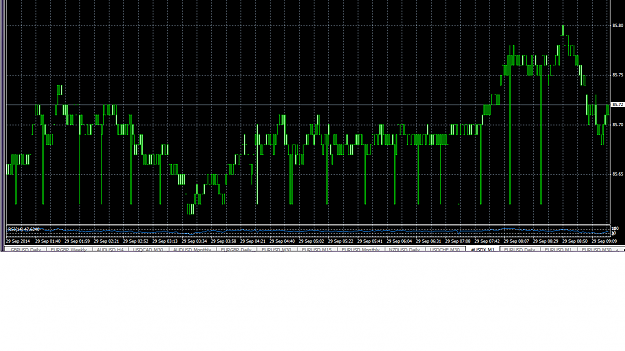
- Red Alert replied Sep 29, 2014
i find this on usdx, what do you think, many spike there....
Cable Update (GBPUSD)
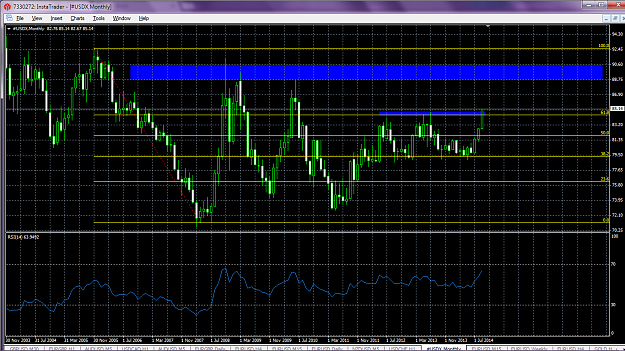
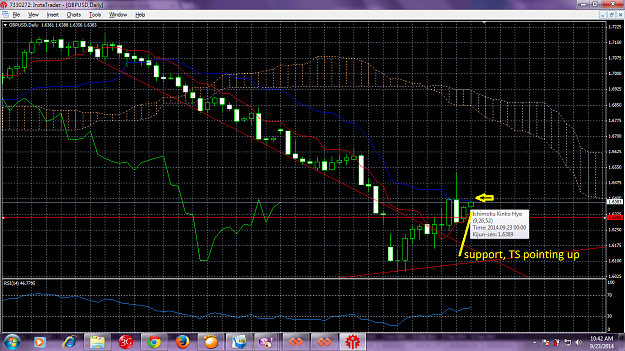
- Red Alert replied Sep 24, 2014
USDX above 61.8 multilear fibo..... Important resistance level what next?....
Cable Update (GBPUSD)
- Red Alert replied Sep 22, 2014
The chart is below: It is clearly, price touching daily KS (blue line) the first time since fall from the roof, .... This is strong resistance for bullish also strong support for bearish, let see what next,,,,
Cable Update (GBPUSD)
- Red Alert replied Aug 30, 2014
Sit down and relax...... this is daily chart Red line (tenkan sen) solid as support for the bear..... as long as the price under red line, bearish remain solid..... You can see the price has been held properly up to now... Regards
Cable Update (GBPUSD)

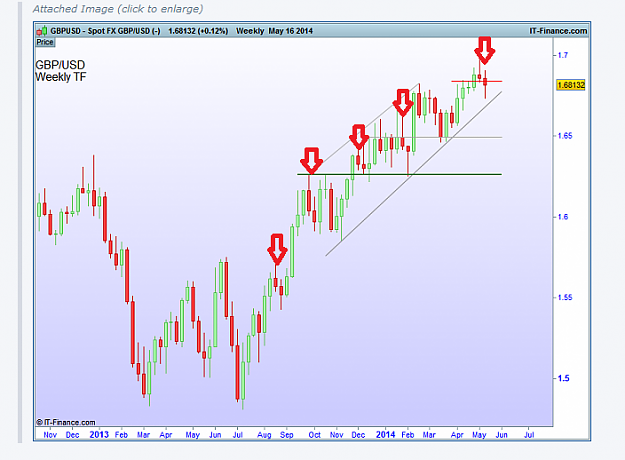
- Red Alert replied May 17, 2014
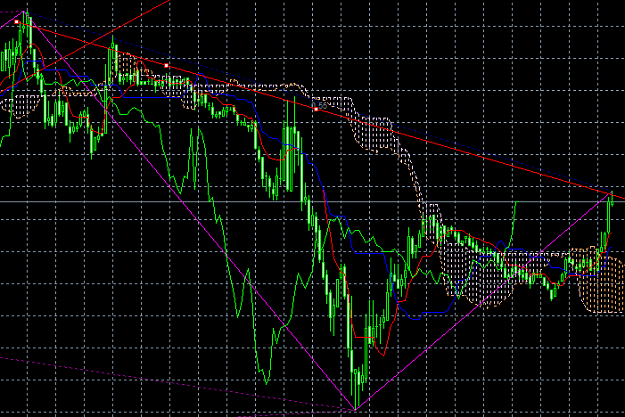
This is my view on weekly, We found some fail bearish set up many times, seems like it will going down but still climbing up, and RSI remain high since august last year (red mark). Historically current RSI is high compared the value since 2011. ...
Cable Update (GBPUSD)
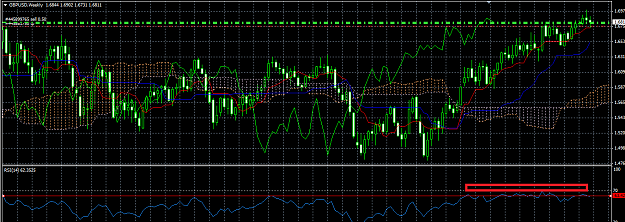
- Red Alert replied May 16, 2014
The price already above white cloud, we have flat sen kou span which will attract price to test the level, the possibility for retest is within 12 hourly candle (flat senkou span, it will touch TS red flat line (tenkan sen) first, it based on my ...
Cable Update (GBPUSD)

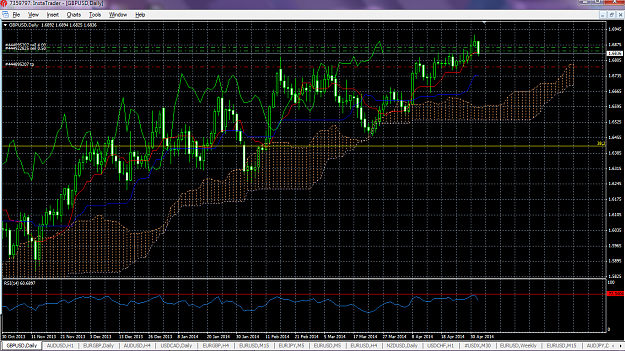
- Red Alert replied May 2, 2014
Maybe it will touch daily KS (blue line), i am not expecting too much, put TP above it
Cable Update (GBPUSD)
- Red Alert replied Mar 15, 2014
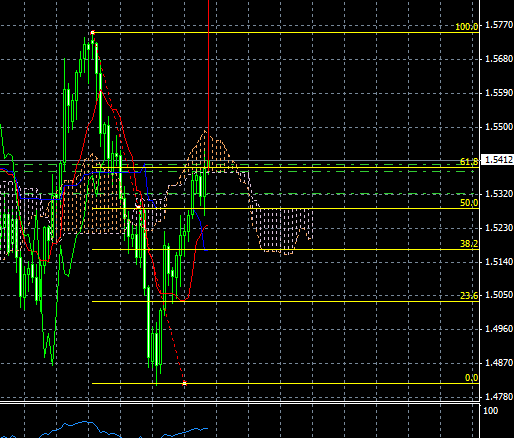
Theoritically yes, fundamentally clearly that the price is too high, but for longer term technically the price still above the kumo on daily TF, based on Fibbo retracement from 1.3500 to 2.1153, the price already break 38.2 level and maybe will test ...
Cable Update (GBPUSD)
- Red Alert replied Jul 26, 2013
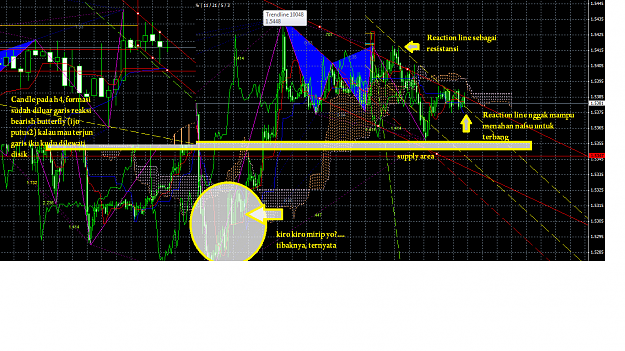
Mas bro, sebagai penyeimbang, iki tak upload dari sisi bullish.....supaya kita berhati2......heheheh Imho (dalam pendapatku yang bijak dan baik hati)...wkwkkwkwk - Ono formasi sing mirip tapi cable malah munggah (dibawah cloud, ks mengarah ...
Paris Van Java Thread
- Red Alert replied Jul 26, 2013
I am trying to plot fibo on daily, seems like the price above fibo 61.8, yesterday the price rejected by 50% fibo.... Overall in daily the price still under the cloud mean bearish still have a reason, but 61.8 fibo broken already...
Cable Update (GBPUSD)
- Red Alert replied Jun 19, 2013
Closed all position, now cable just kiss the red trend line and bounced from there.....let see
Cable Update (GBPUSD)
- Red Alert replied Jun 15, 2013
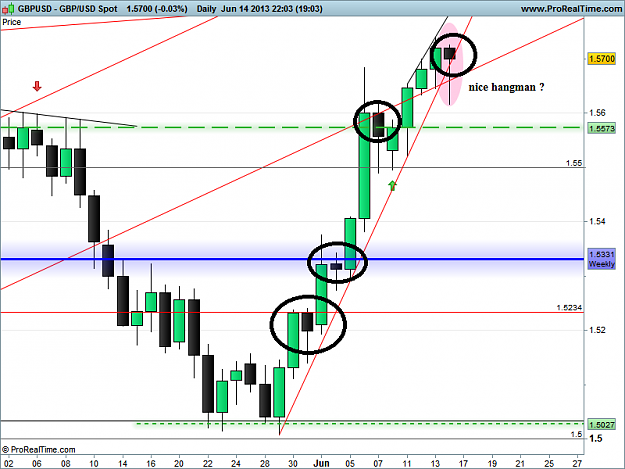
Hello bones, sorry to use your chart..... We have daily bearish with long pin bar, based on previous pattern, daily bearish followed by aggressive bullish, the different is the latest bearish candle broke the daily trend line but closed near the ...
Cable Update (GBPUSD)
- Red Alert replied Jun 7, 2013
The similar pattern after strong bullish move, i am sure, as soon as we have strong move we will try to shorts for retrace, but you know what next.... What about this time?.....
Cable Update (GBPUSD)
- Red Alert replied Jun 7, 2013
Hi nav, thank you for your appreciation....., and now still wait for new entry, this is Friday anyway ...H4 forming engulfing bearish candle, but it is not closed yet.... Bearish for small correction after yesterday crazy bullish?... Bearish will be ...
Cable Update (GBPUSD)