- Search Energy EXCH
- 9 Results

-
 RazorFish replied Apr 7, 2017
Some members are paranoid and just live to nag and prank new members.. I picture them some one like this
EURUSD

- RazorFish replied Apr 5, 2017
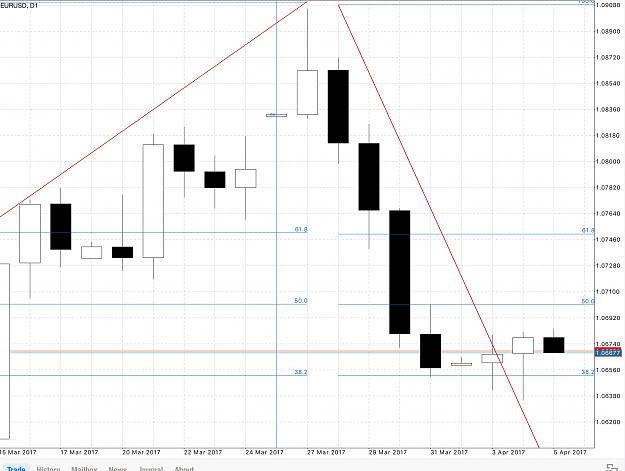
image What do you think , on daily is that a bearish or bullish chart ? Fib 38.2 was tested for 4 days and got rejected , yesterday closed as a bullish pin bar closing on the high ...
EURUSD
- RazorFish replied Apr 5, 2017
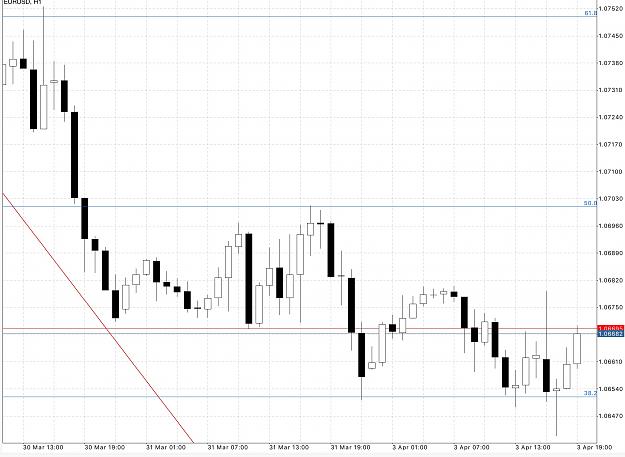
image .0712 thats 50 fib level which is the immediate target for now
EURUSD

- RazorFish replied Apr 5, 2017
According to my Fib Model, we might see it all the way to 1.0900, according to fib chart below, the new wave will take prices higher image
EURUSD

- RazorFish replied Apr 4, 2017
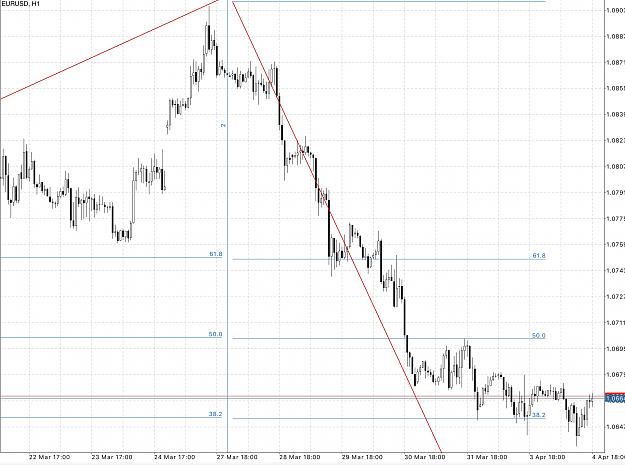
image there is descending wedge on 38.2 fibs which could lead to upward break out at any time, the wedge started from 30th of march till today that's about a week time on 1H
EURUSD
- RazorFish replied Apr 3, 2017
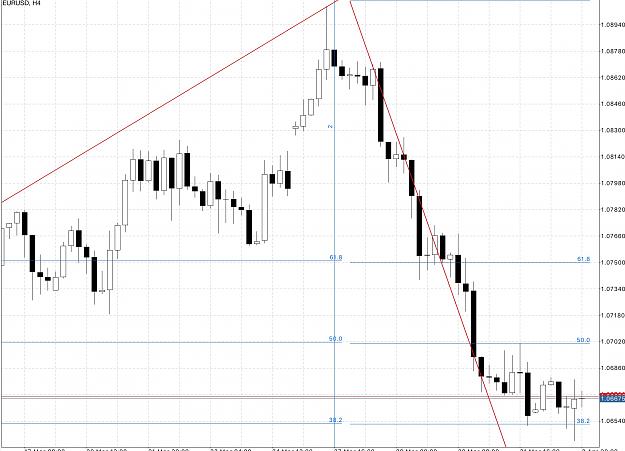
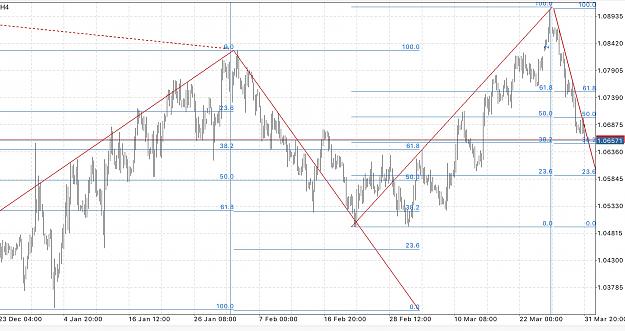
image On 4H it's fairly bullish sign right above my 38.2 fib level, if there is a decisive price action upward it's worth going long at 1.0673 for longer term trade for up to 30 pips
EURUSD
- RazorFish replied Apr 3, 2017
image thats 3 months Fibonacci , it's based on last Friday closing, the prices indicate on the uptrend on the fib and it closed at 61.8 and 38.2 respectively according triangular fib which indicates Area of new trend formation and likely towards ...
EURUSD
- Posts by Member Search: 'RazorFish'