- Search Energy EXCH
- 23 Results
-
 PugsMcGee replied Aug 2, 2013
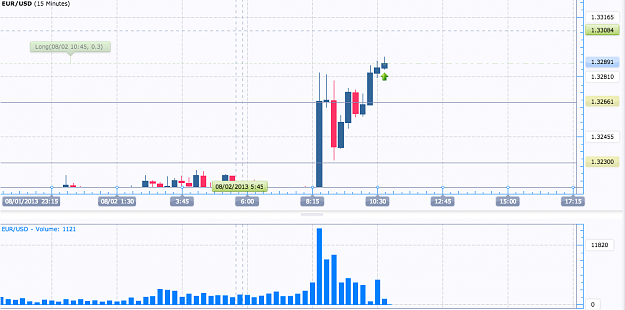
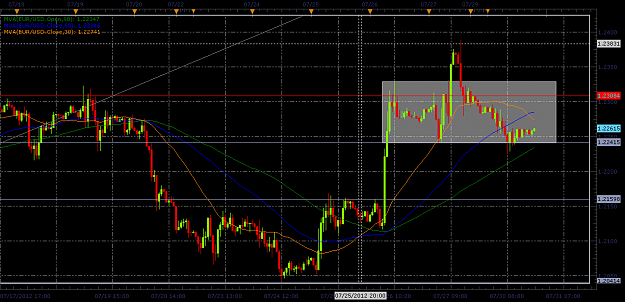
Don't die on me now thread! I've just found you! Price level at 1.3265. Second candle to the right has high volume and price is rising (away form price level). I'm long here as price doesn't seem interested in returning to 1.3265 level. Thoughts?
Volume Price Level Trading
- PugsMcGee replied Aug 2, 2012
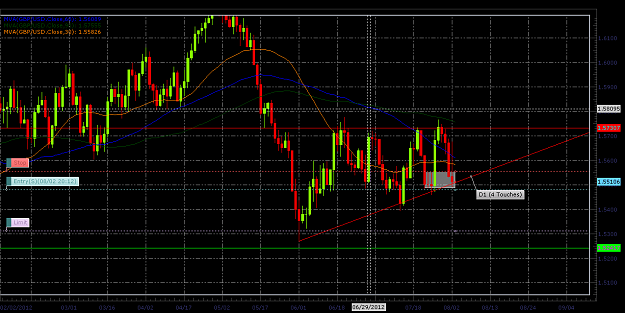
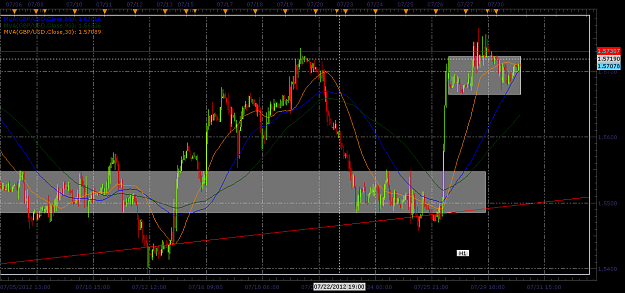
GBP/USD We can see that on the D1 TF there is a substantial ascending triangle. Price has bounced off of the lower TL 4 times. A bounce back to the top is likely, however we are in a DT according to my 30, 60, and 90 Day SMA's. Because of this I ...
Trend is an Ocean
- PugsMcGee replied Aug 2, 2012
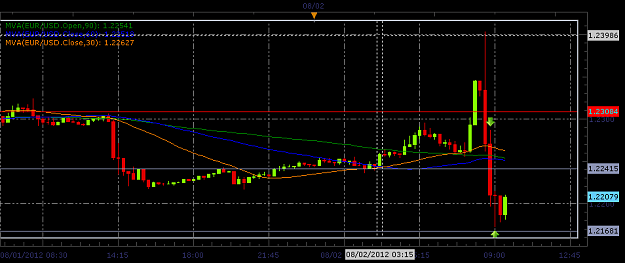
EUR/USD: +30 Pips We can see that price broke out North but then returned to convergence area where it broke out South, allowing me to short the pair, which then quickly hit my TP.
Trend is an Ocean
- PugsMcGee replied Aug 1, 2012
EUR/USD 15M Breakout example. We have a strong consolidation, with 26 bars (27 in the making). On this TF we are in a DT, as we can see from our SMA's, so if we breakout the South I'll be selling. SL is 30 Pips; TP is 30 Pips Once again, lower TF, ...
Trend is an Ocean
- PugsMcGee replied Aug 1, 2012
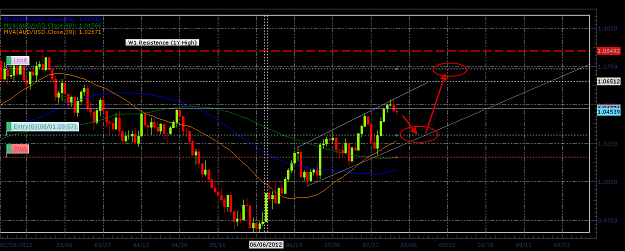
AUD/USD Here's an example of where I will be purchasing in Support area on the D1 TF. We can see that the pair is in an upward channel, and hopefully will continue. SL is 140 Pips; TP is 430 Pips
Trend is an Ocean
- PugsMcGee replied Aug 1, 2012
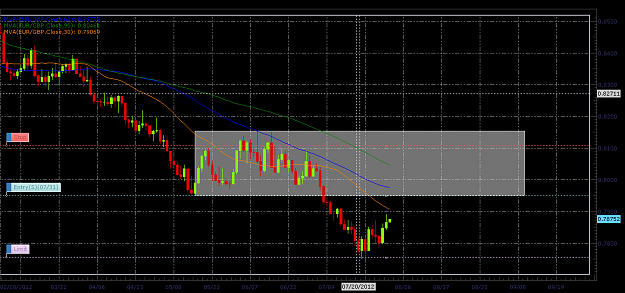
EUR/GBP This is an example of when I will be selling at Resistance on D1 TF. We recently broke out of a pretty strong consolidation area, and so will be shorting if it returns to the breakout area. We can see that the 30 SMA is below the 60 SMA ...
Trend is an Ocean
- PugsMcGee replied Jul 30, 2012
Waiting for H1 candle to close beneath 1.5665 to show go short.
Cable Update (GBPUSD)
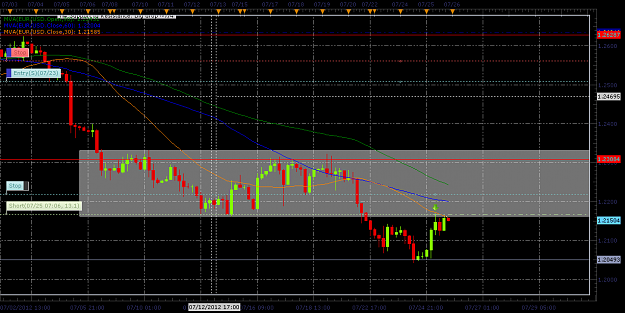
- PugsMcGee replied Jul 30, 2012
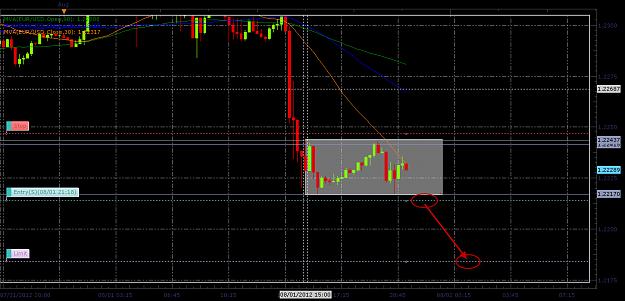
This is my H1 view. I'll short if candle closes beneath 1.2240.
EURUSD
- PugsMcGee replied Jul 29, 2012
Will sell if H1 candle closes below 1.22405. Price target 1.2168.
EURUSD
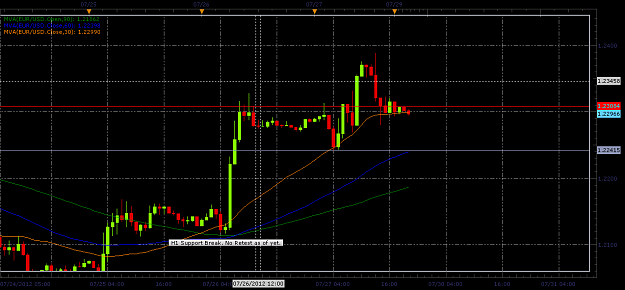
- PugsMcGee replied Jul 25, 2012
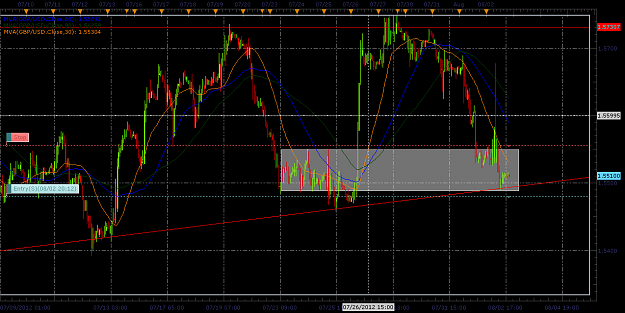
Price broke support; turned to resistance. Went short, and will close if H1 Candle breaks resistance and closes in the previous range.
EURUSD
- PugsMcGee replied Dec 29, 2010
Think we'll see this going higher. At an UTL and also at 50% fib.
EURUSD
- PugsMcGee replied Oct 21, 2010
Here's what my chart sees. Price returning to 1.37. Sold at 1.399, SL at be. Lets see where PA takes us
EURUSD
- PugsMcGee replied Oct 5, 2010
Short to 23.6% fib, then that should be a good place to go long for London session...if it makes it there...
AUD/USD
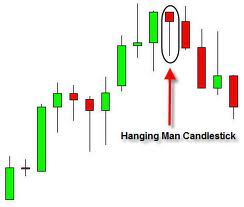
- PugsMcGee replied Oct 5, 2010
Look at that beautiful Hanging Man on the Daily. I think I'll go short. Only doubt is that the perception of the dollar is so weak at the moment, so macro econ. might take over and go bull.
AUD/USD