- Search Energy EXCH
- 582 Results
-
 Pair-me-up replied Aug 18, 2022
I do put up my charts quite often. But on my discord channel that I created at the request of other traders that want to study price action. Again.. if you go to my profile you will know how to stop by and say hello. As far as the Nasdaq, etc. It ...
Ratios & Harmonics: a Different Way to Trade
- Pair-me-up replied Apr 17, 2022
Nice info. Here is my price action trade that I took with 2 micro contracts on the Nasdaq. I use zero lagging indicators such as MACD, EMA, SMA, stochastics, etc. But over the weekend I was trying to learn a few more things from the economic side. ...
Yieldjunkie's Short-term Sentiment: Indices, Macro Risk Env
- Pair-me-up replied Feb 24, 2022
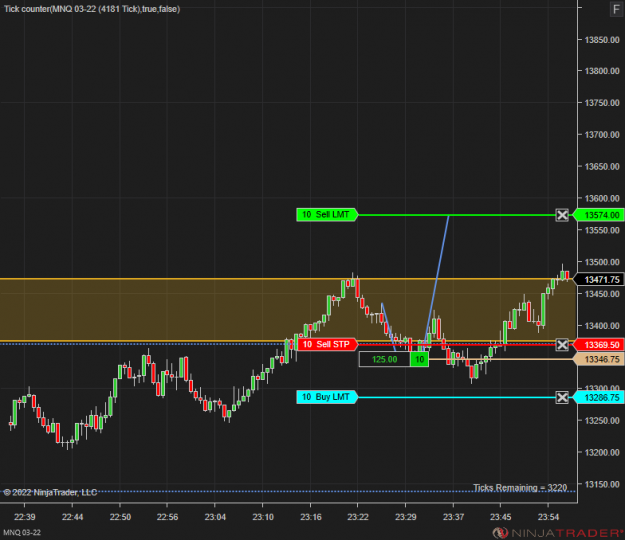
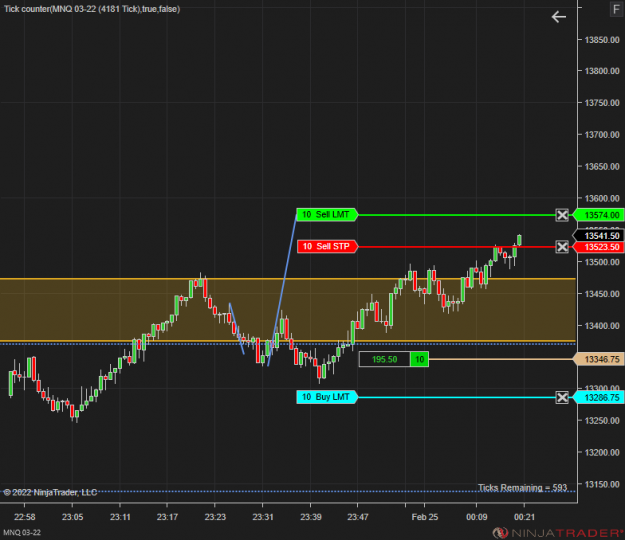
image image This was my second trade for the night. I set my limit orders and then and went to do some cardio. Came back and trailed it. Got stopped out on my trail. This is the Micro NQ. So, each point contains 4 ticks.
Ratios & Harmonics: a Different Way to Trade
- Pair-me-up replied Feb 24, 2022
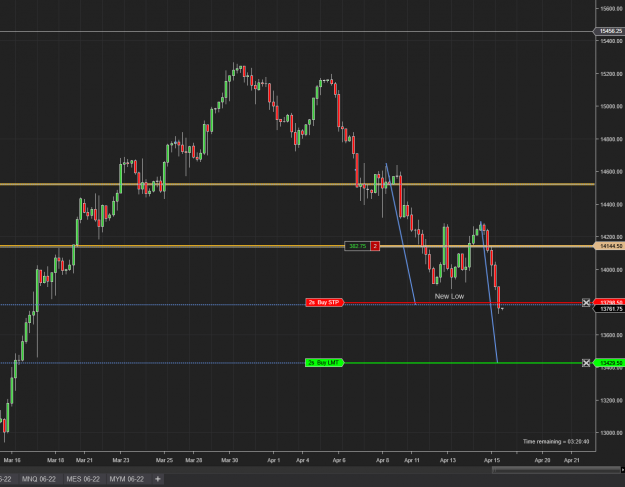
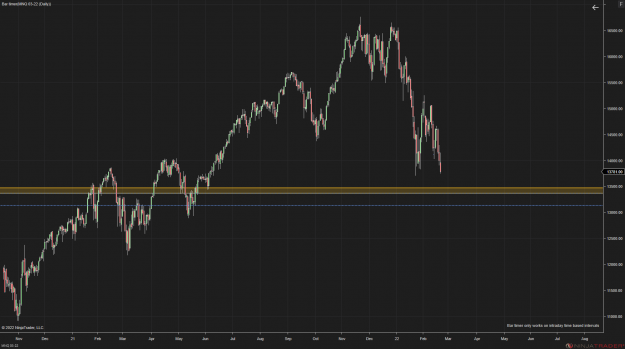
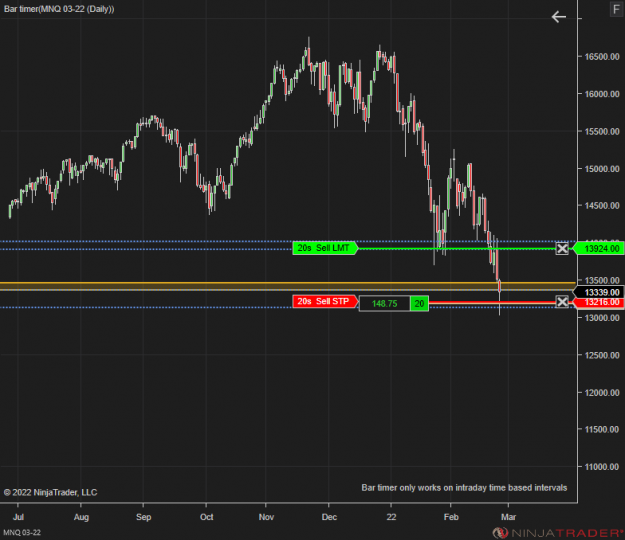
image image As you can see.. I planned this out two days ago. With the war issue, I did calculate the possibility of some extra draw down.
Ratios & Harmonics: a Different Way to Trade
- Pair-me-up replied Feb 23, 2022
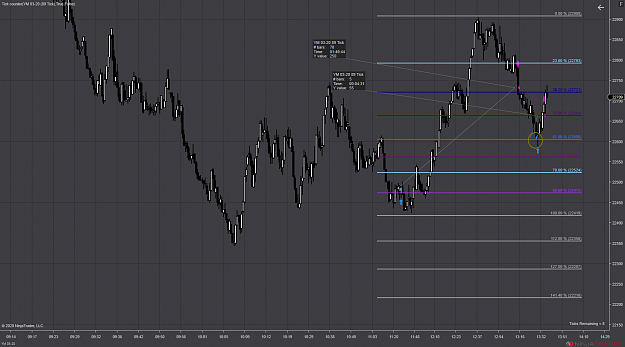
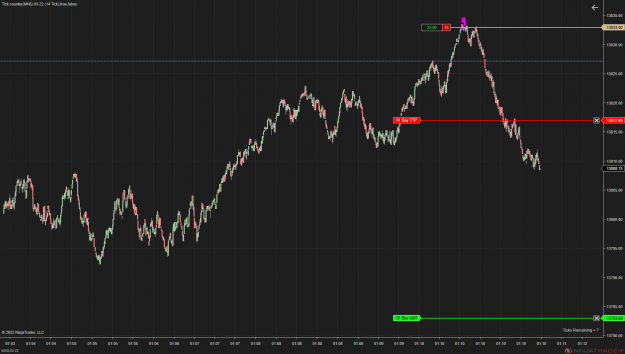
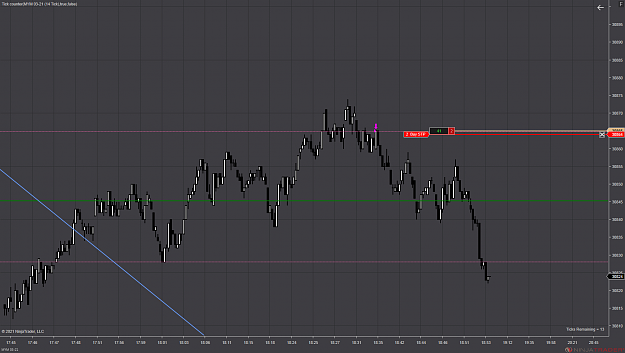
image This is an entry that I took on my 14 tick chart. It was based on price action behavior that I have been studying recently. I am trying to find consistent behavior for it. This trade went against me 2 ticks. It lasted for a few minutes tops, ...
Ratios & Harmonics: a Different Way to Trade
- Pair-me-up replied Feb 21, 2022
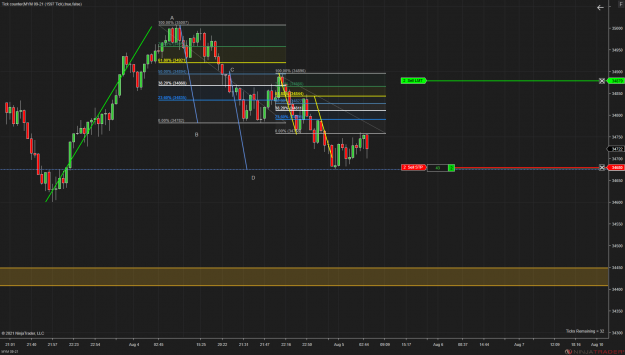
image For my price action homies.. This is one of my favorite setups.. if it can be found. As you can see... I marked my main swing in green. As price started to retrace down, you can see that it went to the 50%. So, I drew my projection lines, not ...
Ratios & Harmonics: a Different Way to Trade
- Pair-me-up replied Feb 14, 2022
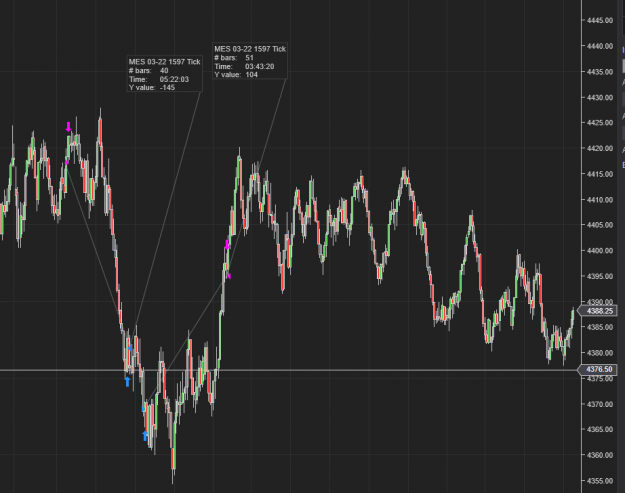
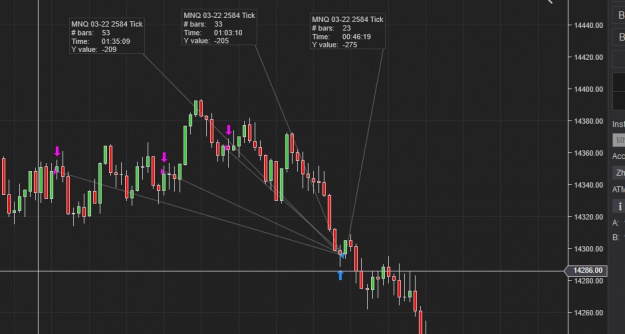
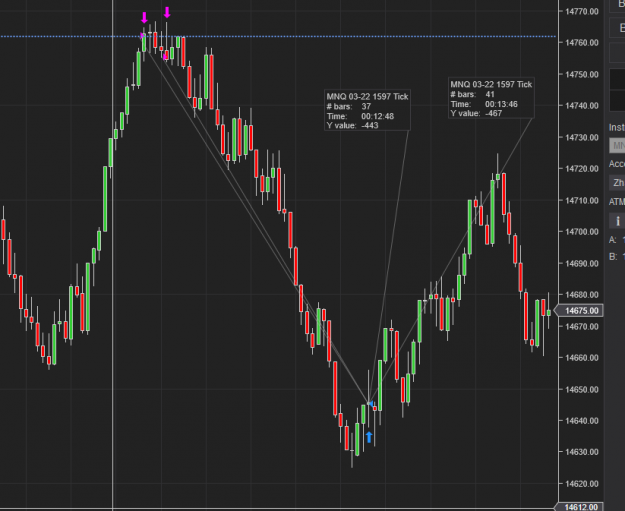
image Micro ES +145 ticks +104 ticks image Micro NQ +209 ticks + 205 tics +275 tics My fills weren't the best, but price did follow my trade plan. Also, great job on some of those entries, Damian. That's what's up.
Ratios & Harmonics: a Different Way to Trade
- Pair-me-up replied Feb 11, 2022
image I had a limit order at my area of interest, that I marked with my blue dashed line. I was confident that price action would really take price down, so I added. Notice, that I am not using price lagging candles, such as rotation candles. I ...
Ratios & Harmonics: a Different Way to Trade
- Pair-me-up replied Jan 24, 2022
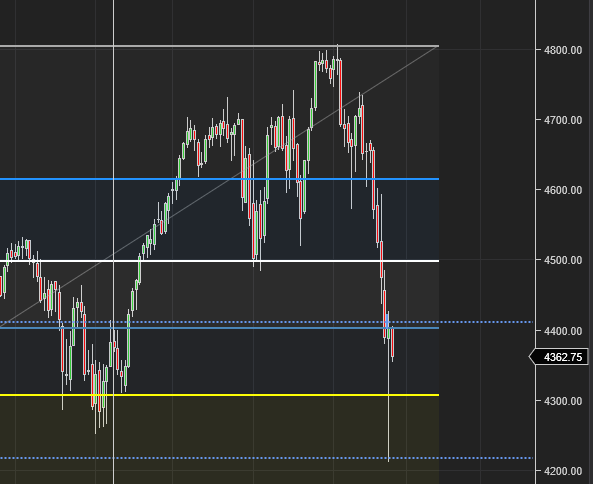
I have been working on another personal price action theory for the larger time frames. Just building on what I discovered a couple of years ago and fine tuning it. The blue lines are my areas of interest for buys and sells. This is a screen shot of ...
Ratios & Harmonics: a Different Way to Trade
- Pair-me-up replied Jan 21, 2022
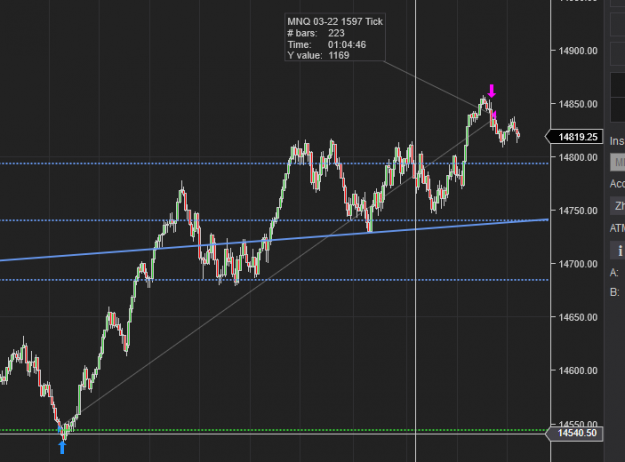
I haven't posted in a while. I got this 1169 positive tick on this 1597t chart. I just want to say.. I didn't need some huge stop loss and I didn't use a rotation candle. It doesn't matter the time frame or the tick chart. Price goes to to the same ...
Ratios & Harmonics: a Different Way to Trade
- Pair-me-up replied Jun 25, 2021
image Thanks for your valuable time that you used for a great response. I will check out that book for sure. I don't trade the NQ yet.. but one of the discord channels that I am on...well.. just about everyone and their dog trades the NQ or the ...
Yieldjunkie's Short-term Sentiment: Indices, Macro Risk Env
- Pair-me-up replied May 27, 2021
image This is from right now.. 1 trade -10 ticks. Second one is doing better. Again.. no rotation candles... Remember that structure is the king and that structure is just a bunch of ranges interacting with each other. O.k. I gotta go. Laterz ...
Ratios & Harmonics: a Different Way to Trade
- Pair-me-up replied May 26, 2021
Here is a trade I just entered just a little while ago.. I used a limit order. image
Ratios & Harmonics: a Different Way to Trade
- Pair-me-up replied May 21, 2021
I use Ninjatrader 8. Metatrader has this feature as well. It is under shapes in Metatrader. I actually prefer the regional high light tool in Ninjatrader as it can let me mark multiple order flows all at once, which allows me to filter my entries ...
Ratios & Harmonics: a Different Way to Trade
- Pair-me-up replied Feb 4, 2021
Good post Matts Micro. As far as harmonics.. Harmonics is just a way to measure the market based on structure being calculated mathematically. Structure will always be stronger than any harmonics by itself. Also, price doesn't stop in a random place ...
Ratios & Harmonics: a Different Way to Trade
- Pair-me-up replied Jan 5, 2021
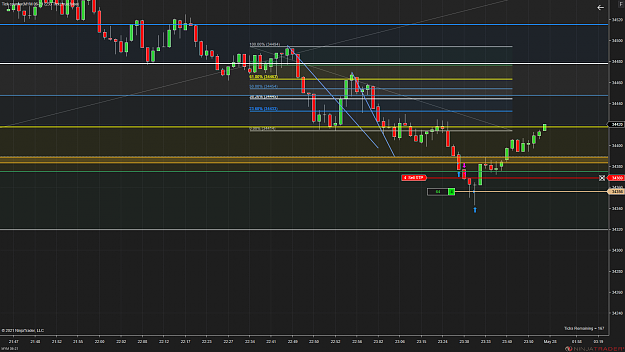
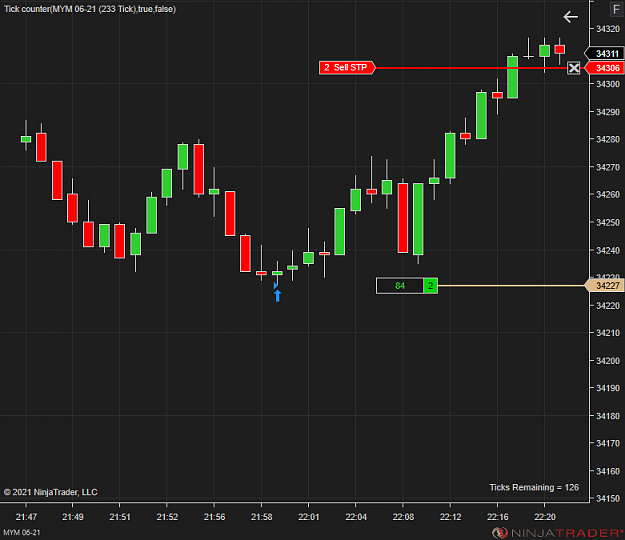
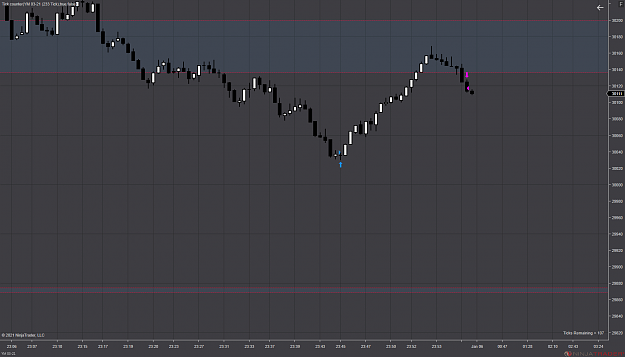
I am out of this trade. Here was the view from the 233 tick chart. image
Ratios & Harmonics: a Different Way to Trade
- Pair-me-up replied Jan 5, 2021
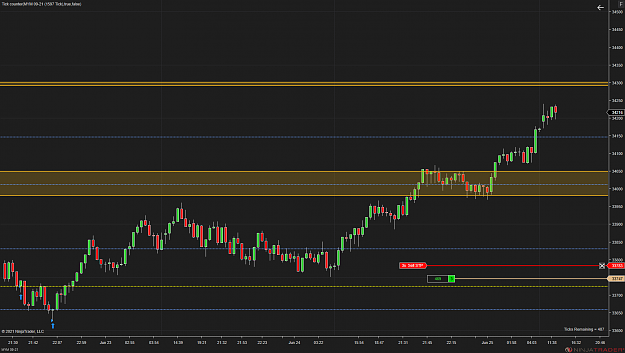
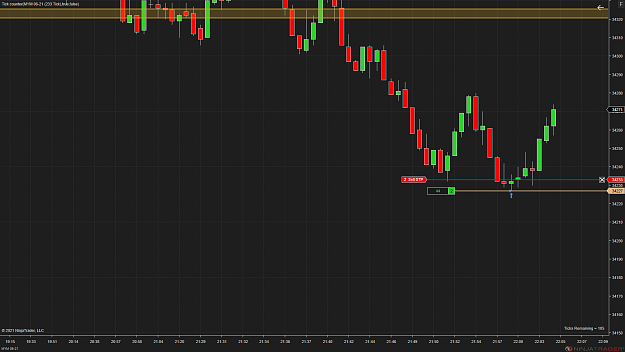
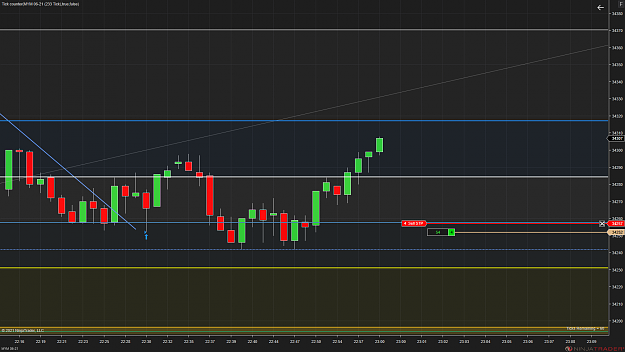
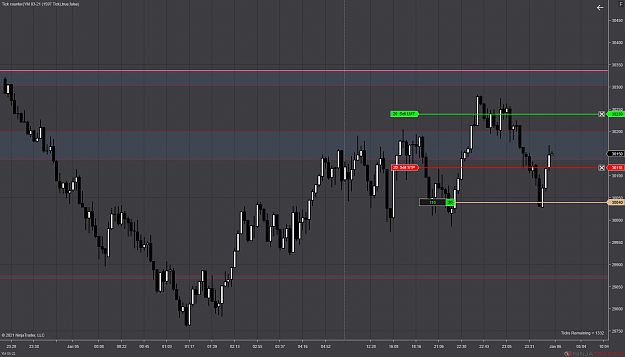
Another crazy price action trade. I used the 1597 for anyone that wants to see things on a larger scale. I use black and white candles. Over year ago I posted some of this style with commentary. Just to give a clue of what I look for in regards to ...
Ratios & Harmonics: a Different Way to Trade
- Pair-me-up replied Jan 4, 2021
Happy New Year, PeterT and all.. I haven't been around in awhile. Last year I had a big computer crash. Then I was at a gym using some TRX equipment, that became disconnected from its base. I fell backwards and on my way down to the floor, there was ...
Ratios & Harmonics: a Different Way to Trade
- Pair-me-up replied Mar 19, 2020
This is the Dow mini from about a week ago. I have other posts somewhere. Nowadays, I only trade the Dow Jones instruments. Good luck.
About the course