- Search Energy EXCH
- 8 Results
-
 Napoleon180 replied Sep 25, 2014
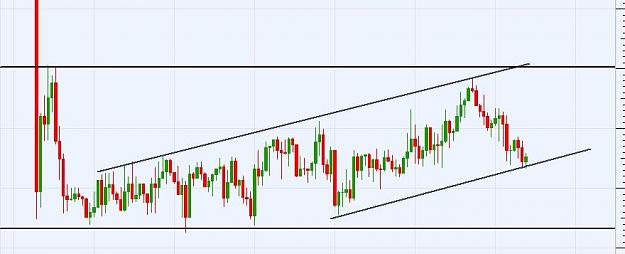
I think you draw it wrong. Of course it could be a channel, but what is more important are the horizontal levels of S/R. We have support at 1,2063 and heavy around 1,2050 and resistance around 1,2090 for the moment. If it breaks 1,2050 then we will ...
EUR/CHF
- Napoleon180 replied Jul 12, 2012
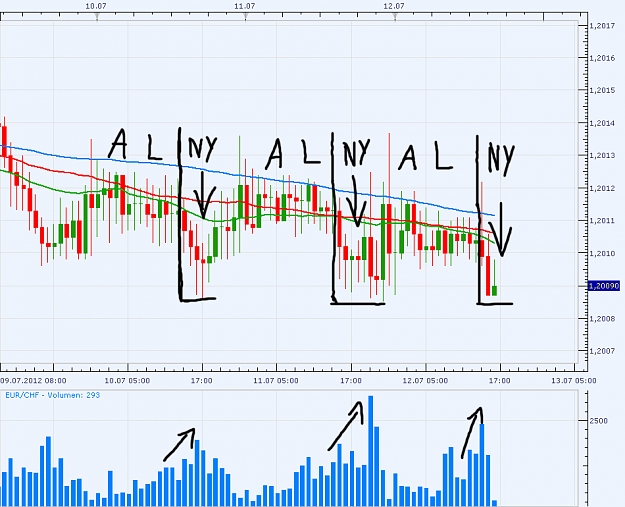
Interesting....the last days when NY opened eur/chf goes down with higher volume, every day the same procedure...
EUR/CHF
- Napoleon180 replied Jul 2, 2012
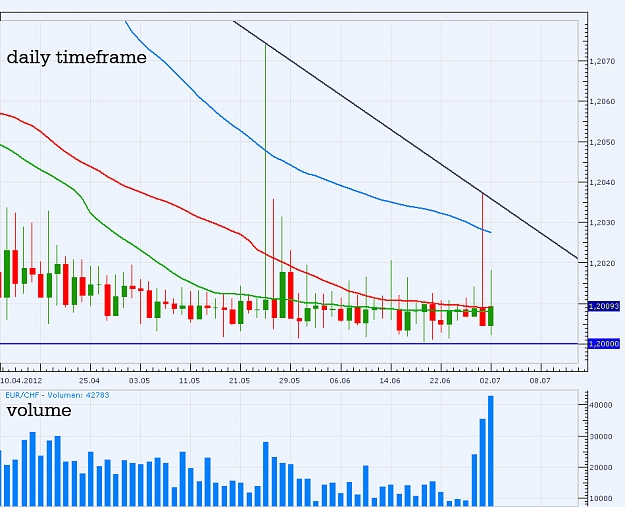
Yep, they try every day to close the daily candle (bid) below 50 (red line) and 30 (green line) SMA...
EUR/CHF
- Napoleon180 replied Jun 20, 2012
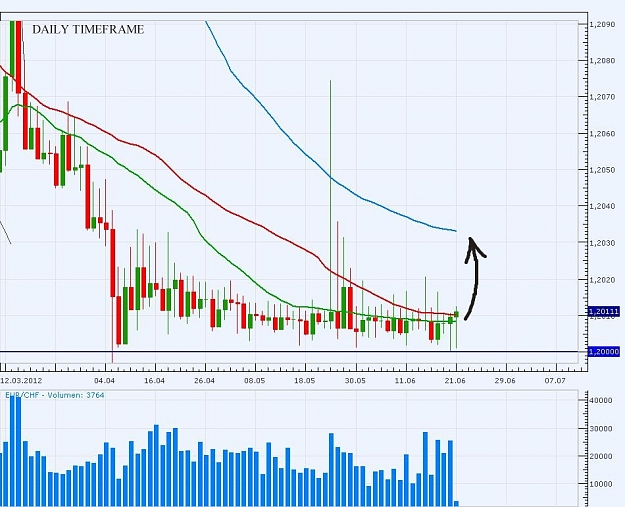
Break to the upside? — It's actually looking quite interesting on the daily timeframe... Till now 30 SMA (green) held every day, but yesterdays candle (nearly a bullish hammer) closed above. Now if the 50 SMA (red) also breaks there would be ...
EUR/CHF
- Napoleon180 replied Mar 22, 2012
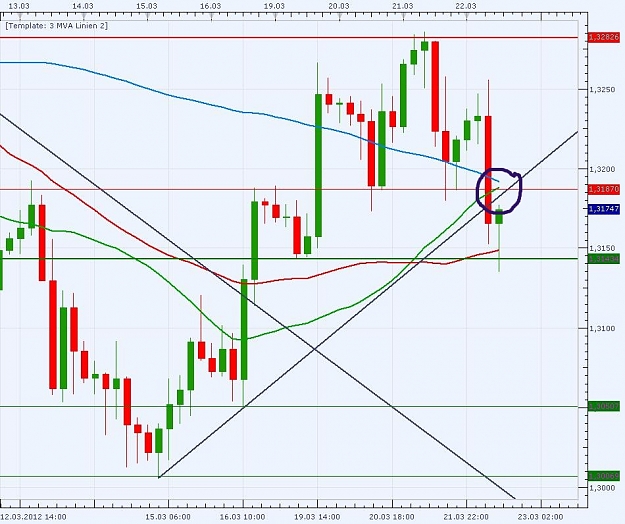
4hr chart, circled area around 1,3185 should be nice resistance...
EURUSD
- Napoleon180 replied Mar 15, 2012
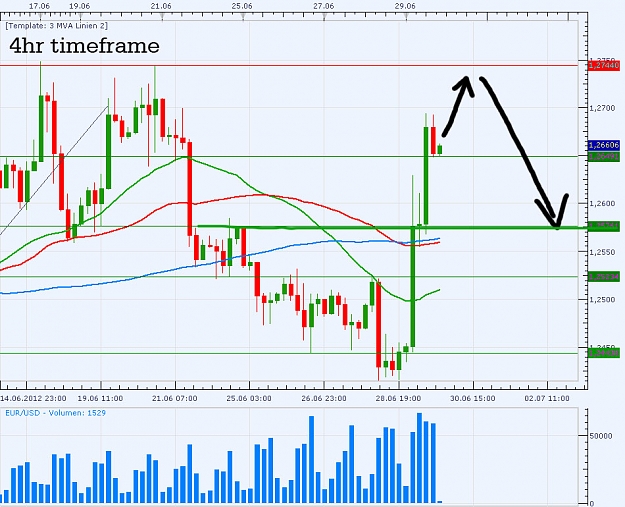
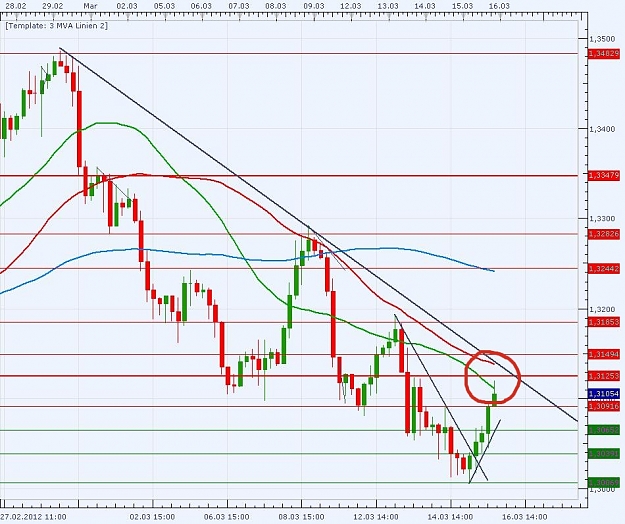
4hr timeframe - red circled space (see below) could be a good place for entering short... We got 30 and 50 SMA very closely together as resistance and down trend line...
EURUSD
- Napoleon180 replied Aug 10, 2010
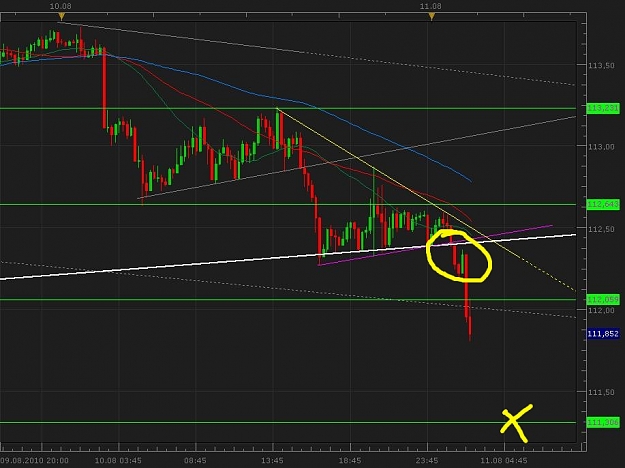
this was a very nice breakout of a triangle...little pullback and continuation... i think next target will be 111,30 ..then 110,75
EUR/JPY Anytime!
- Posts by Member Search: 'Napoleon180'