- Search Energy EXCH
- 20 Results
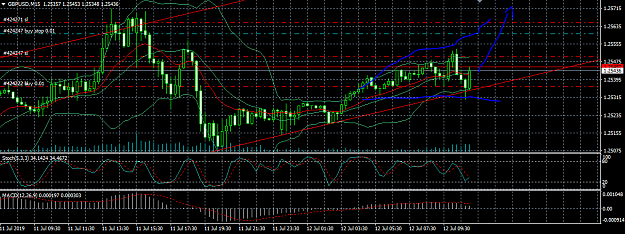
- Mrcl replied Jul 12, 2019
Its already started for me ~ image 6 pips win and on going... Note : May be I need to be like Theoak, He wins multiple times by spamming this forum about his trades. Whether it lose or win. Its somekind of FF black magic or something, Nice one ...
Cable Update (GBPUSD)
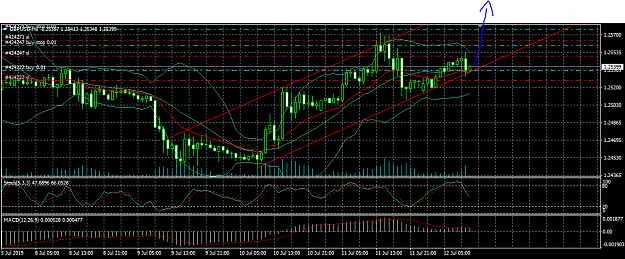
- Mrcl replied May 29, 2019
Moty, will u let me know when u end ur buy ? Im starting to think to let go my buy, but still have doubt, waiting for double bottom in H4. image
Cable Update (GBPUSD)
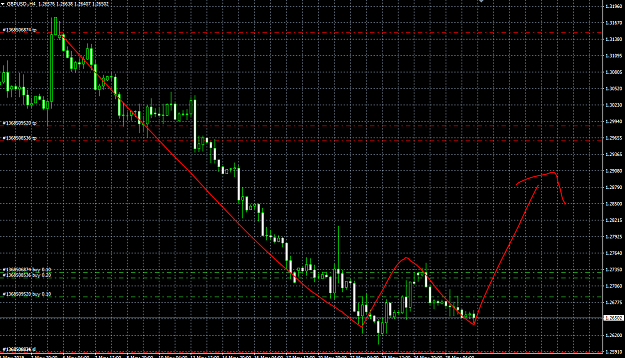
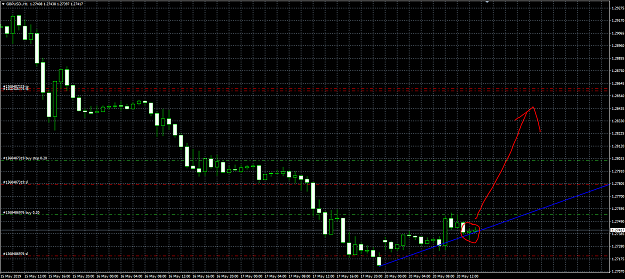
- Mrcl replied May 26, 2019
Does any one know how long (in days) is the Bank holiday for UK and US ? I thought this week gonna be bullish. A doji and a big bullish bar as confirmation. image But seeing the bank holidays, spread gonna be gigantic ~ (plus an additional spread ...
Cable Update (GBPUSD)

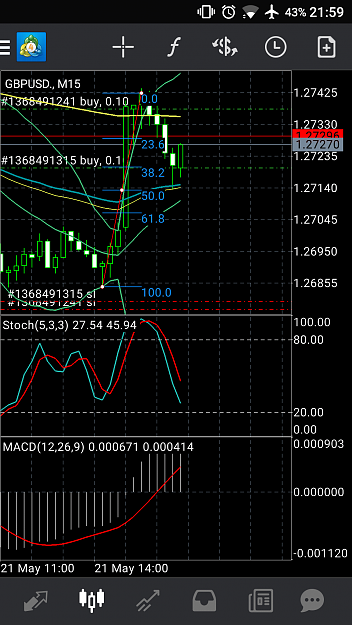
- Mrcl replied May 20, 2019
image A pin bar and uptrend. If it goes higher in the next....30 min, I'll add more 'buy' Best of luck.
Cable Update (GBPUSD)
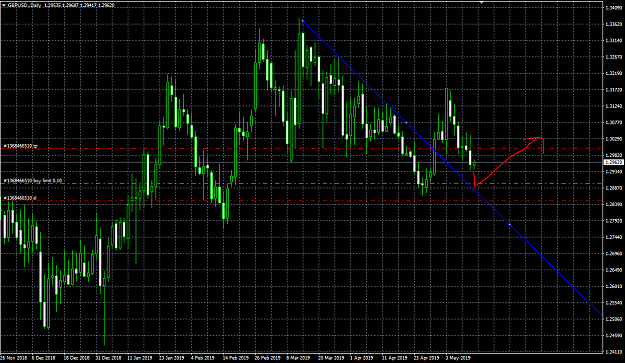
- Mrcl replied May 13, 2019
My Buy Limit on 1.2900 TP 100pips on 1.3000 SL 50pips on 1.2850 image
Cable Update (GBPUSD)
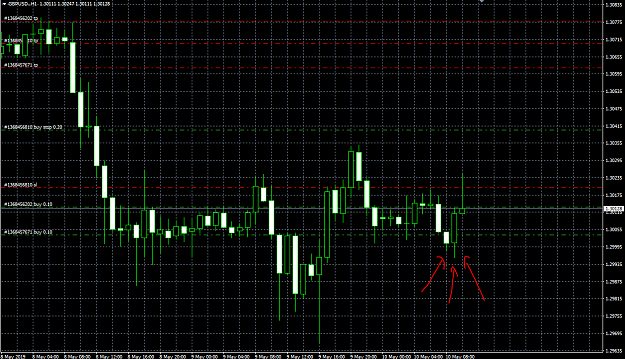
- Mrcl replied May 9, 2019
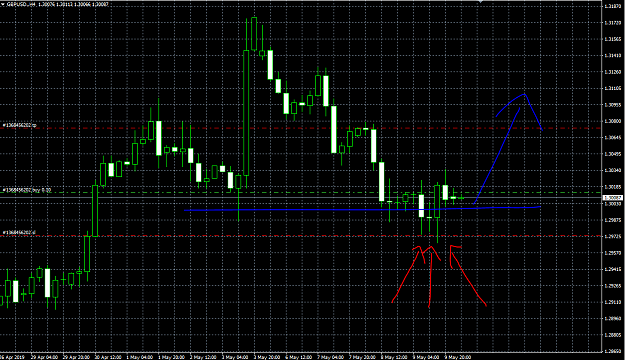
A multi-candle bullish pattern is created in 4H chart (Its "Morning Star" pattern if im not mistaken with terminology) Plus... Its reach a support level... Testing the theory, but if its true, I missed the best entry point in 1.29ish. Bummer... ...
Cable Update (GBPUSD)
- Mrcl replied May 7, 2019
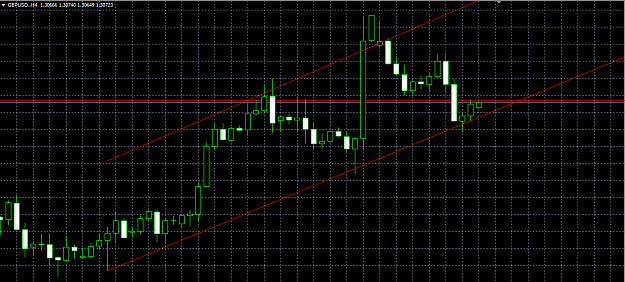
Agreed... The 4H chart shows a short uptrend... Will be waiting till London open to judge... Meanwhile, stay low in the sideline... image
Cable Update (GBPUSD)
- Mrcl replied Apr 29, 2019
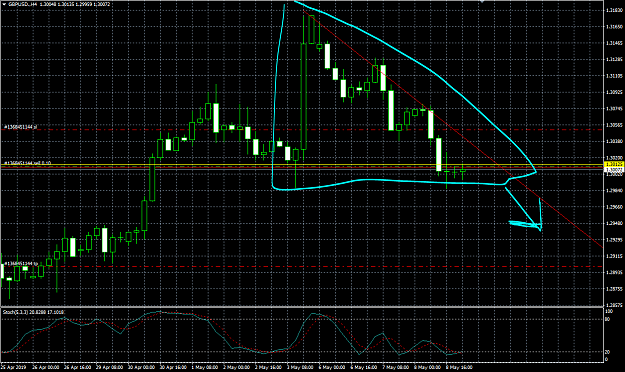
Be careful mate, The price is going in to the trendline and resistance. It may bounce back down in the trendline or resistance. image I putting a Sell Limit on 1.29550 with thin SL hoping it bounce back down in the trend line. Any way, Trade safe, ...
Cable Update (GBPUSD)
- Mrcl replied Apr 28, 2019
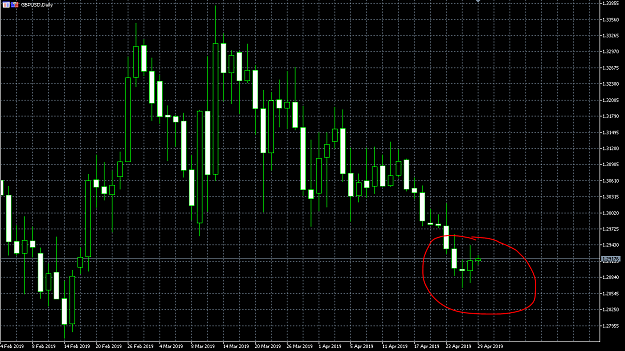
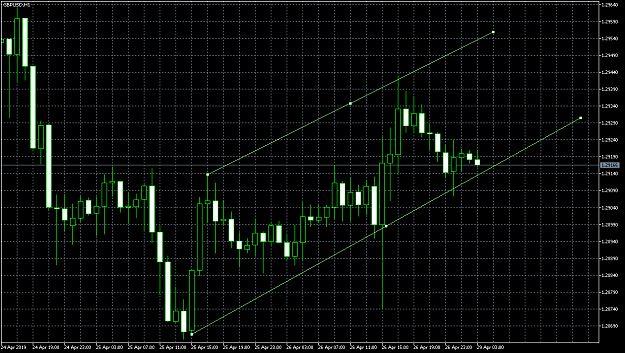
It looks like GU will go up at least for today and tomorrow. image An up trend is created on H1 chart. image A Morning star pattern is created on D1 chart. Despite a down trend... Thats why may be its gonna go up for 1 or 2 days until it touch ...
Cable Update (GBPUSD)
- Mrcl replied Apr 25, 2019
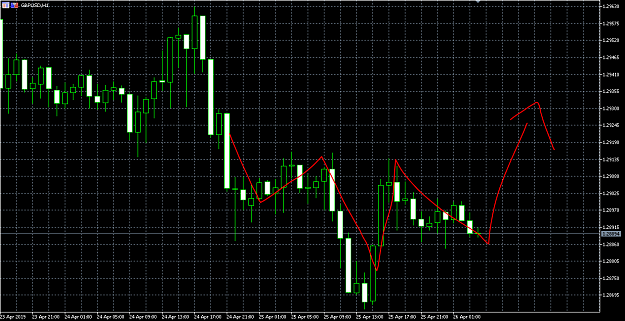
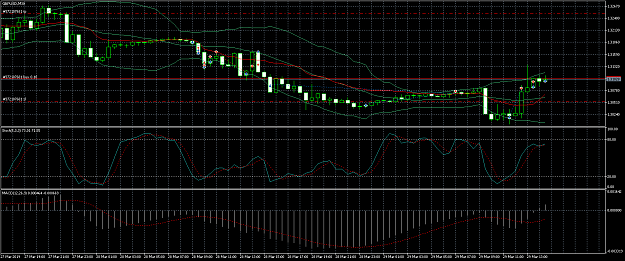
Are you sure ?, IMHO, I think the retracement MAYBE already on progress. A bullish shoulder pattern MAY created on H1 chart. image Plus the daily stochastic chart showing a reversal is on going. That's why I end all my sell transaction, and also ...
Cable Update (GBPUSD)
- Mrcl replied Apr 23, 2019
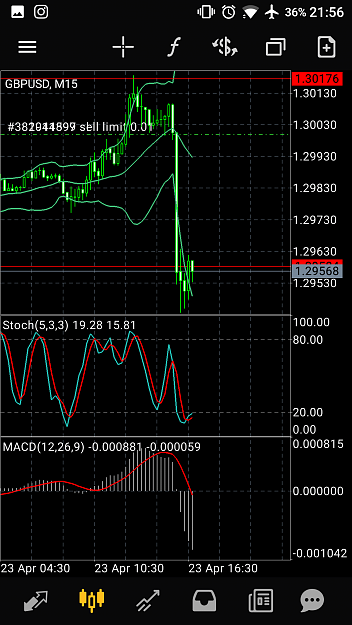
The stochastic says the price is over sold already. I think its gonna go up for a short term before continue going downwards. image
Cable Update (GBPUSD)
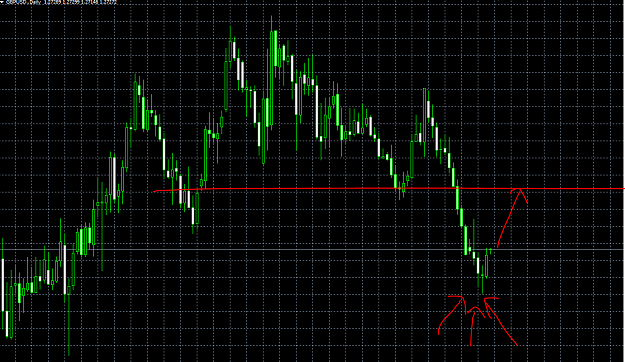
- Mrcl replied Apr 18, 2019
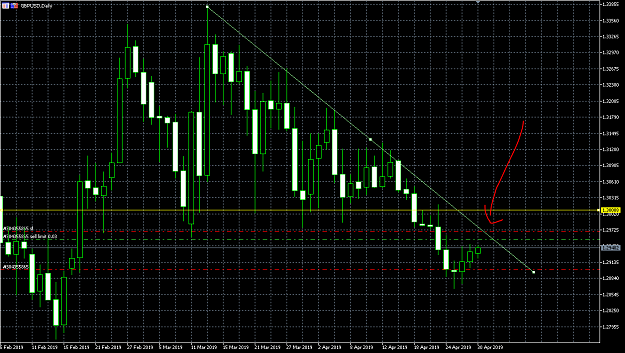
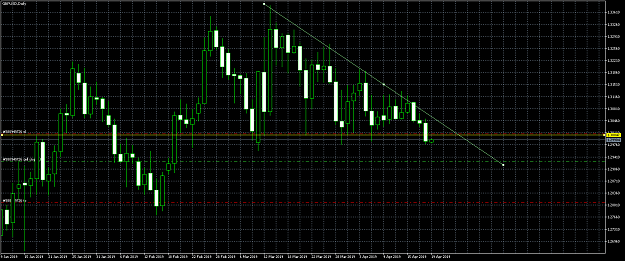
A descending triangle is still intact in Daily chart. Price still currently holding in the support line. But once it break .... Woooogh boy ..... Im ready to board inside the "Bearish Train Express" Sell Stop on 1.29274 image
Cable Update (GBPUSD)
- Mrcl replied Apr 12, 2019
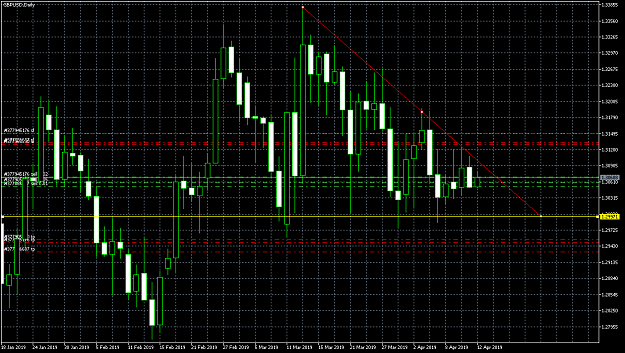
A descending triangle was form in the daily chart. GU will dive to the deep ~ image Now playing : "Rolling in the Deep" by Adele
Cable Update (GBPUSD)
- Mrcl replied Apr 11, 2019
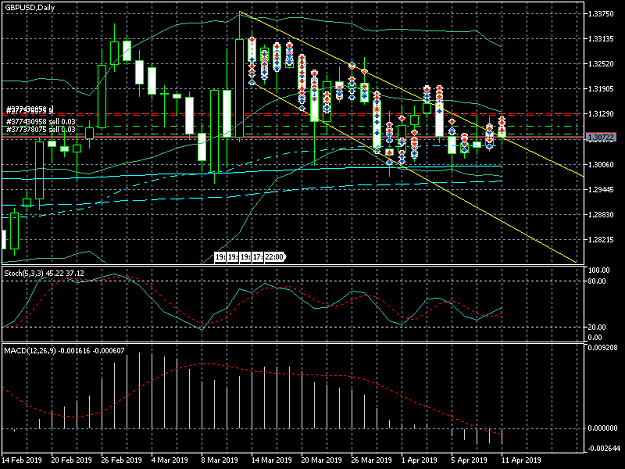
The drop is coming... Or is it ? perhaps for the next 7 hours, USD is correcting after going outside the trend line. P.S : Sorry for the messy diagram, still new to this FX thingy ~
Cable Update (GBPUSD)
- Posts by Member Search: 'Mrcl'