- Search Energy EXCH
- 18 Results (1 Thread , 17 Replies )
-
 Masmp_FX replied Mar 25, 2008
qwer1234 Thanks for your reply and your help, but I have tested the indicator you posted here in Word file, and it doesn't show the real EMA angle, I will post a picture showing it. There are 2 indicators there measuring the EMA angle, yours is the ...
30min EMA 21
- EMA ANGLEStarted Mar 17, 2008|Trading Systems|9 replies

Hello, I'm having some problems with the Ema Angle indicator, I will post some pictures here that's ...
- Masmp_FX replied Jan 28, 2008
hey, how is my new avatar?
Cesarnc's market talk, gossips, rumours & fun

- Masmp_FX replied Jan 15, 2008
I will try to explain, When you have a setup, Gann Hilo is at a certain value, stop loss must be put 40 pips above it, as for trailing stop, I use an emergency trailing stop, that only takes effect if there is a big movement against me, TS is always ...
Gann Hilo DMI System
- Masmp_FX replied Jan 13, 2008
Charts In Candlesticks — Charts In Candlesticks
Getting rid of indicators
- Masmp_FX replied Jan 12, 2008
here is one of the improvements — The blue line is Gann Hilo at 10, and Orange Line is Gann Hilo at 3 and other indicators discarded, I have gained an extra 130 pips on the setup, and more 100 pips on the Exit, witch turned a previous +295 ...
Getting rid of indicators
- Masmp_FX replied Jan 12, 2008
Let me start with the ranging time — Most of those trades where previously filtered by DMI, and QQE. In this image I lost 125 pips, not a big deal
Getting rid of indicators
- Masmp_FX replied Dec 10, 2007
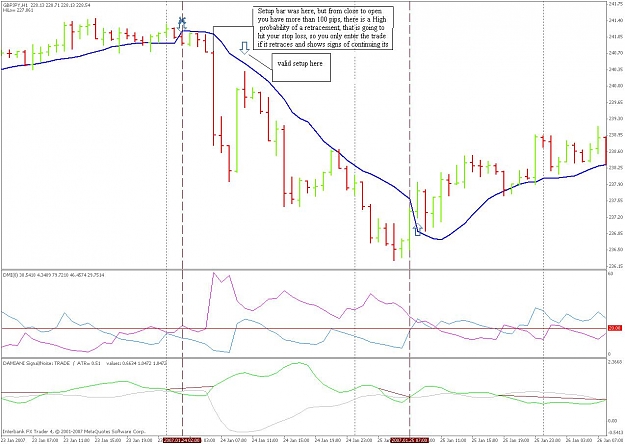
100 pips bar example — Here is an example of a rare event, where you could safely put trade after a bar with more than 90 pips from open to close.
Gann Hilo DMI System
- Masmp_FX replied Dec 4, 2007
System Rules — The guaranteed rules that work, are on GY, trading 1h charts For Short - Price below gann hilo, DMI red line above 20 line, and QQE doted line above blue straight line, the candle must move from close to open more than 3 pips, ...
Gann Hilo DMI System
- Masmp_FX replied Nov 26, 2007
Interbank FX Chart — Interbank FX Chart
Metatrader data feed Help Please

- Masmp_FX replied Oct 10, 2007
The arrows represent the entry, the vertical bars, would represent an exit if take profit or stop loss was not hit, it may close sooner than the vertical line, and I, am sorry that a made a mistake in my statement about 9 October, I told 3 long ...
GBP/USD Force Index System
- Masmp_FX replied Oct 8, 2007
Screenshot — Here are 2 trades the first hit my 40 pip goal, and the second trade was with 19 pips when momentum crossed 10 ema. Note, I only use Bollinger Bands, to see if market is making a good movement.
GBP/USD Force Index System
- Masmp_FX replied Oct 8, 2007
Screenshot — Here is a good trade, it went 60 pips my way after my setup, take profit was at 40 pips as you can see, price as break true ema 21, stochastic passes 40 level, in case take profit or stop loss was not hit, exit would be at the ...
GBP/USD Force Index System
- Masmp_FX replied Oct 6, 2007
A snapshot of some trades — This was a very good day
GBP/USD Force Index System
- Masmp_FX replied Aug 28, 2007
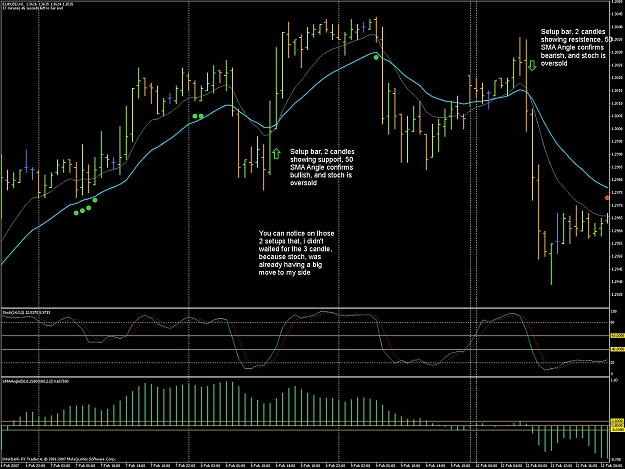
1 Bullish and 1 Bearish — Correction on The first setup, its says there that stoch is oversold, my mistake, overbought is the correction. Sorry
Philip Nell, system on 1 H TF, using FULL STOCH,
- Masmp_FX replied Aug 28, 2007
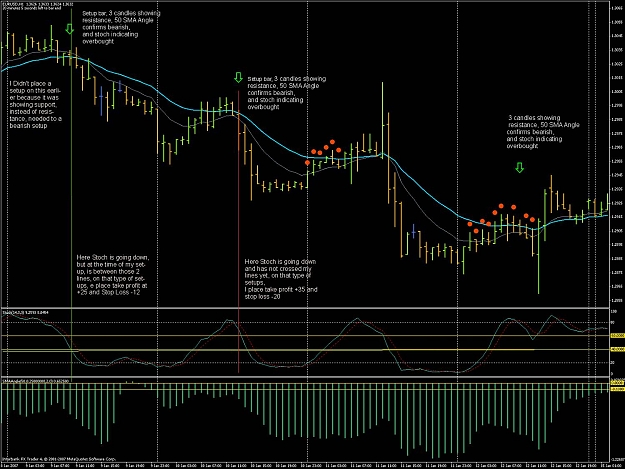
Charts — Here are 3 Bearish setups
Philip Nell, system on 1 H TF, using FULL STOCH,
- Posts by Member Search: 'Masmp_FX'