- Search Energy EXCH
- 29 Results
- MarcusFire replied Nov 25, 2013
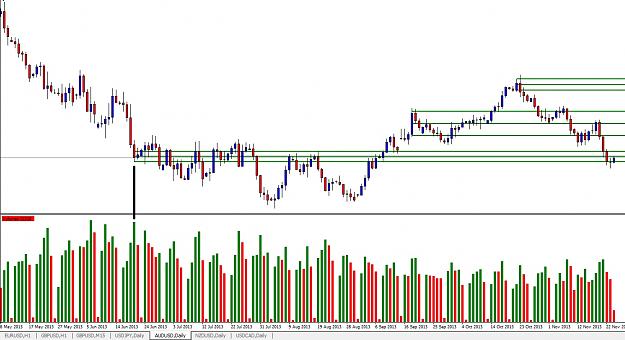
Jason . . . As my Polish ancestors would say about your squat example: Yumski. Back to trading . . . Here is a daily chart of the Aussie . .. If I were not already long EU . . . I would probably be taking a long on AU now with a wide stop. And hey ...
vsa with Malcolm
- MarcusFire replied Aug 1, 2013
SD - GU - Closed my long . . . New Perspective . . . Good Call! :-)
vsa with Malcolm
- MarcusFire replied Jul 31, 2013
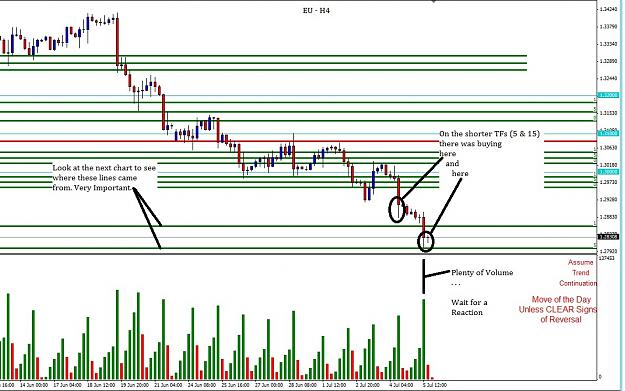
Hi SD . . . I'm on hold for the moment on EU. It's back at a crucial price range where the sellers absorbed the hell out of the buyers back in June. I want to see which way it goes through this Fib Zone*** before taking a position.
vsa with Malcolm
- MarcusFire replied Jul 31, 2013
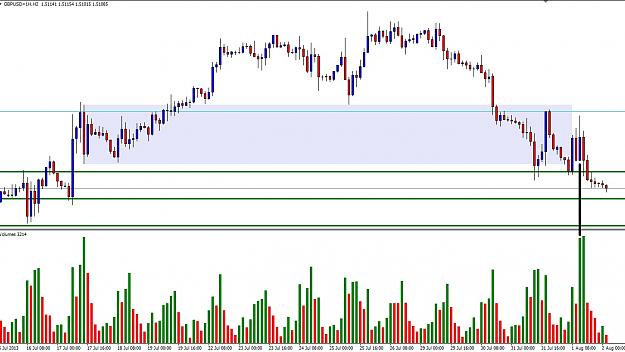
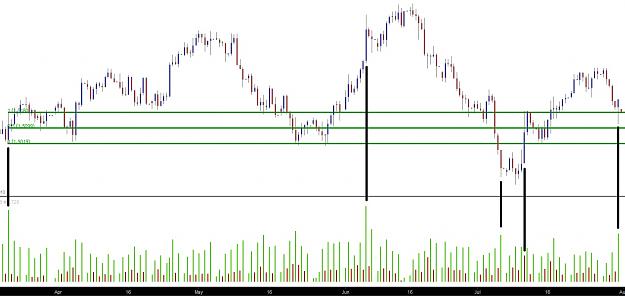
Hello Malcolmites . . . Chart of Pound Futures . . . 12 Hour . . . I'm looking for longs . . .
vsa with Malcolm
- MarcusFire replied Jul 7, 2013
Some buying is hitting, but trend change has not happened yet. Patience.
vsa with Malcolm
- MarcusFire replied Jun 26, 2013
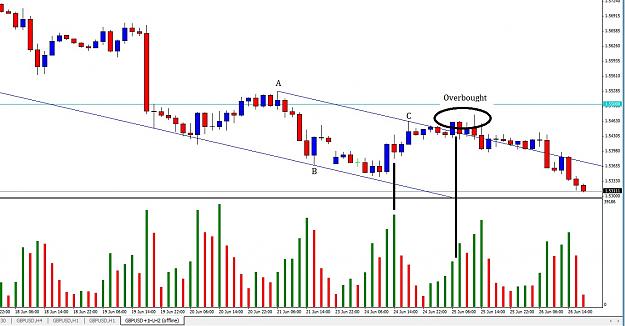
I jumped the gun on that GU short. I should not have taken the first sign of selling. (NEVER take the first sign!) Look at the PA in the overbought region after the trend channel forms. Two hour chart: Points ABC to set up Trend Channel That UHV ...
vsa with Malcolm
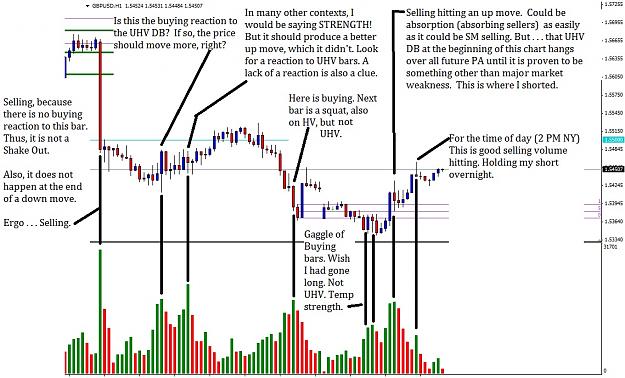
- MarcusFire replied Jun 24, 2013
Current take on GU. I've been trading this more than EU because it's been moving better lately. There was plenty of Market top and Trend Change action the last two weeks or so, so I'll just say the BG prior to this chart is weak. If you disagree, ...
vsa with Malcolm
- MarcusFire replied May 17, 2013
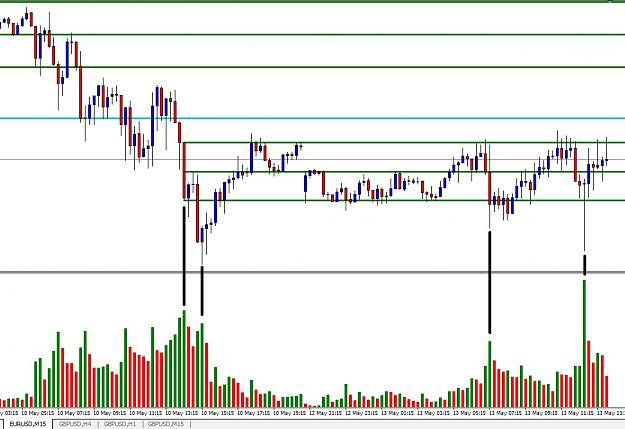
Here is my Thursday trade on EU that I closed on Friday at 2812 for 85 pips. The trend for the week is down, so I'm waiting for short opps. Five marked bars are as follows: 1. Previous lows taken out on good volume - No strong signs of buying or ...
vsa with Malcolm
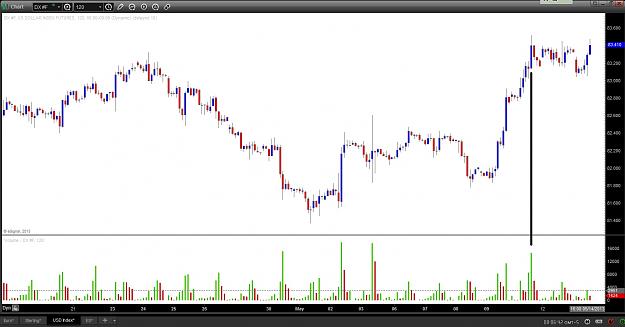
- MarcusFire replied May 14, 2013
Keeping an eye on this potential BC on USD Futures.
vsa with Malcolm
- MarcusFire replied May 13, 2013
Still some sellers around on the 1 hour chart. Unless something dramatic happens in the next 30-60 minutes, it would be best to wait until at least the Asian session to consider longs. Selling evident on M15 as well. Top of that Fib Zone is ...
vsa with Malcolm
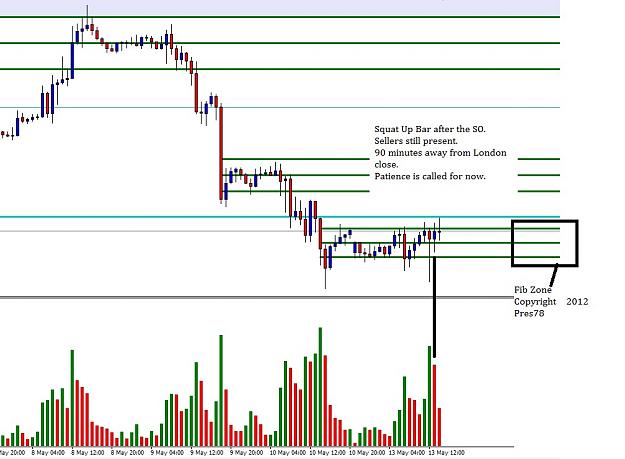
- MarcusFire replied May 13, 2013
Selling Climax, Stopping Volume, SC/SV and lastly a Shakeout. Just waiting for that test. It's always awesome to hear from Malcolm . . even to tell us how the good life is working out for him.
vsa with Malcolm Jason - Nice to see you back in it, m'man!
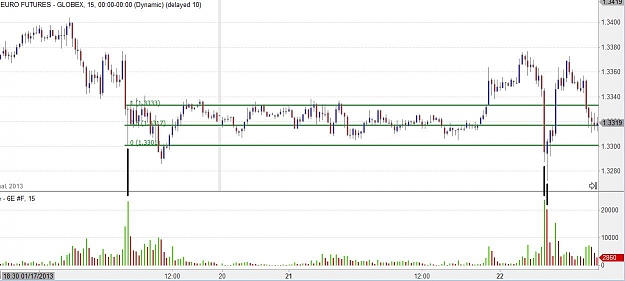
- MarcusFire replied Jan 27, 2013
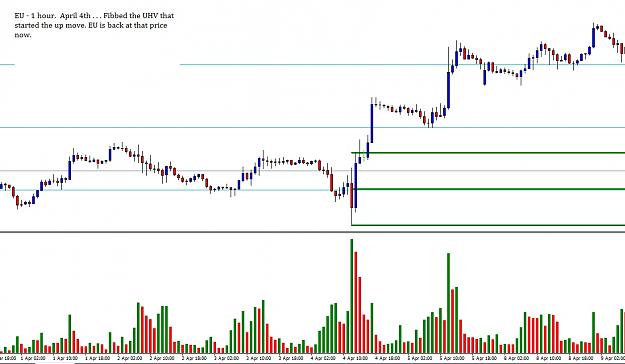
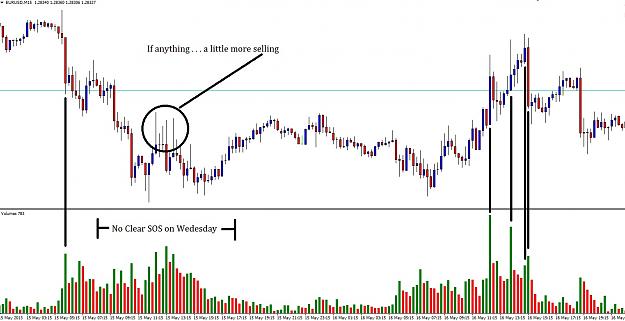
The chart below shows what I was looking at on Wednesday when I made the call to buy dips for the week. Call was made here, at Steve & Liam's place (soon to be renamed the Jason Memorial Repository of Knowledge
vsa with Malcolm ) with a two-hour chart: url But ...
- MarcusFire replied May 5, 2012
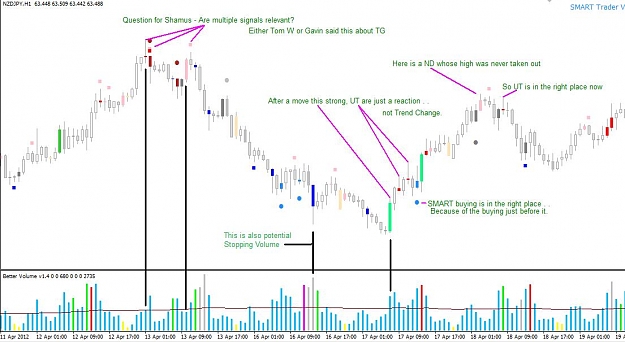
Chart Analysis using SMART — I know these are all 20/20 hindsight trades, but I'm wondering if this is a good way to do chart analysis with SMART. Three questions here: 1. It was either Tom Williams or Gavin who said that a cluster of all ...
Trade Using VSA (Volume Spread Analysis)
- MarcusFire replied Jan 5, 2012
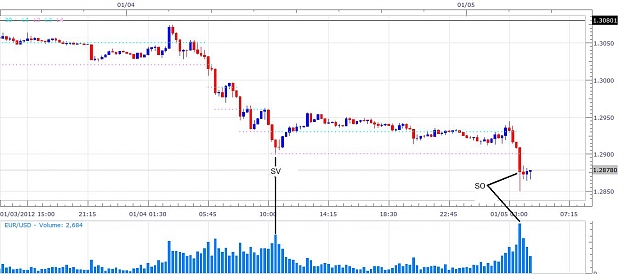
EUR/USD 15 Minute Chart — Looks like Stopping Volume and a Shakeout on EUR/USD. Also, the bar before the Shakeout is squat, but with high volume. So maybe the buying already started on that bar? Looking for signs of reversal now. Patience.
vsa with Malcolm
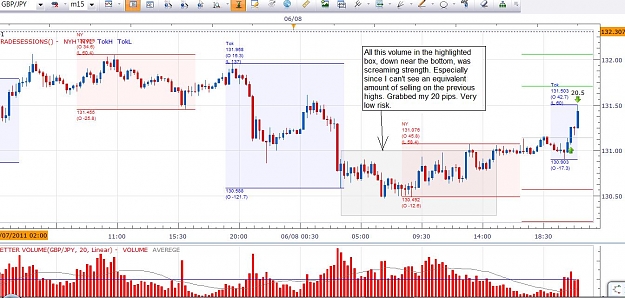
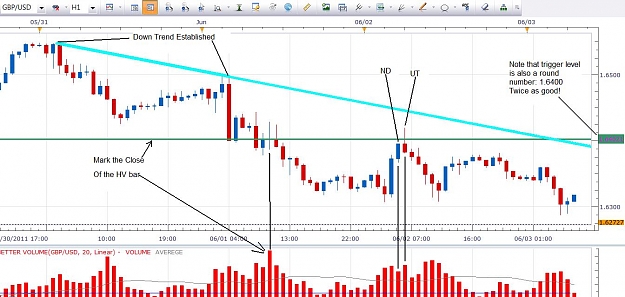
- MarcusFire replied Jun 3, 2011
Over thinking — Sometimes I miss the simple thing right in front of me. I was waiting for the price to get closer to the trend line before I took a short. Yet, shorting that UT would have been the smart thing to do. Hindsight . . . sigh.
vsa with Malcolm
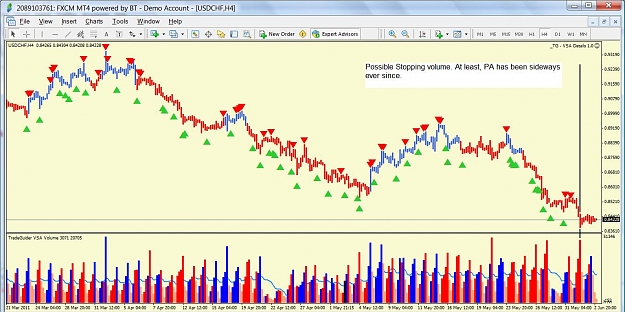
- MarcusFire replied Jun 2, 2011
USD/CHF — Sorry that the detail is all crammed into the bottom right corner of this chart, but I think the Price Action in the background is important. 1. Long down move. 2. Possible stopping volume. 3. Price moves sideways. My thought is that ...
vsa with Malcolm
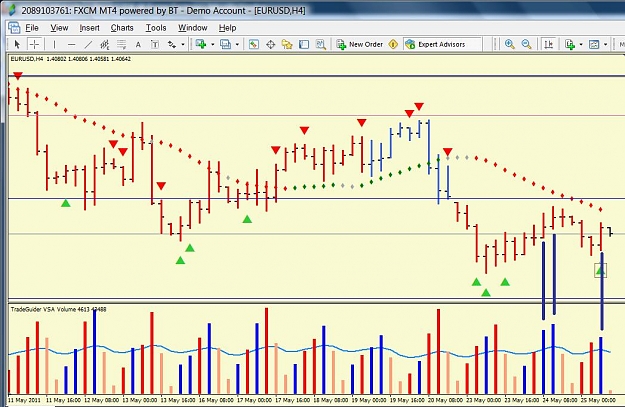
- MarcusFire replied May 25, 2011
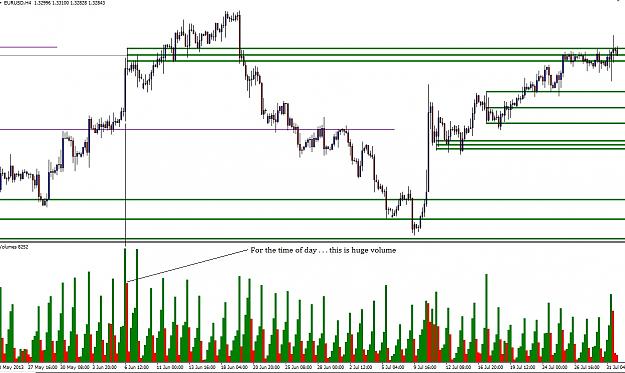
EUR/USD 4H — Does anyone else find it significant that the highest V bars in the last two days have all been up bars?
vsa with Malcolm
- MarcusFire replied May 19, 2011
USD/CHF — I've made money three times on USD/CHF the last 4 weeks. (I posted one :-) But now I'm wondering how to read the current chart. What would anyone else do with this? Is this two=bar reversal? You can see the OBVIOUS trade I took and ...
vsa with Malcolm
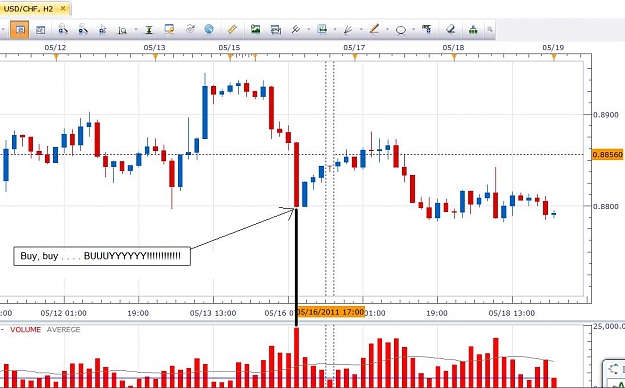
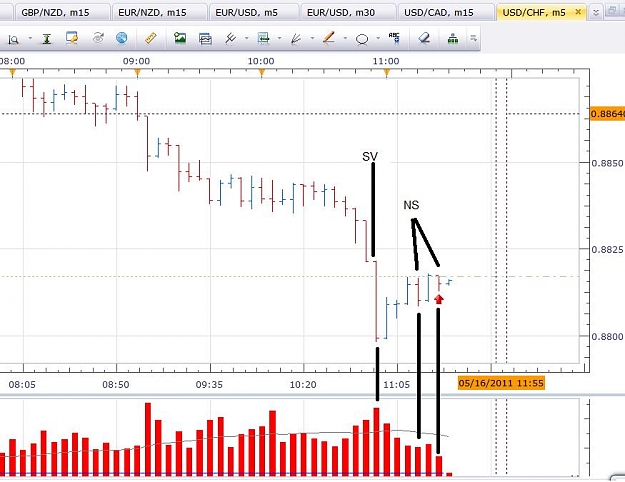
- MarcusFire replied May 16, 2011
Long USD/CHF — Three key SOS in background: 1. In an uptrend. 2. 4H time frame shows 8800 as a previous key resistance level over the last two weeks. 3. Level was broken and 8800 was support during a shakeout at the end of last week. Now, we ...
vsa with Malcolm