- Search Energy EXCH
- 15 Results
-
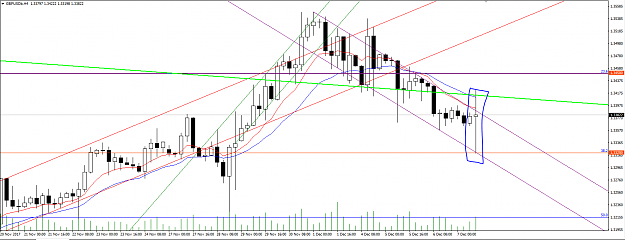
 Macpher replied Dec 13, 2017
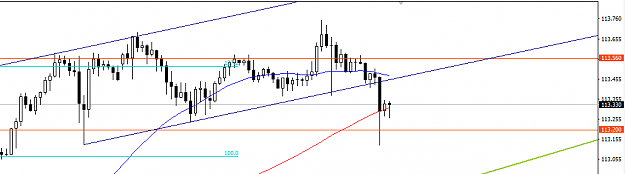
i see it breakouts of my channel line, tempting to sell it but then FOMC coming up... maybe i'll just wait and see
USD/JPY Discussion
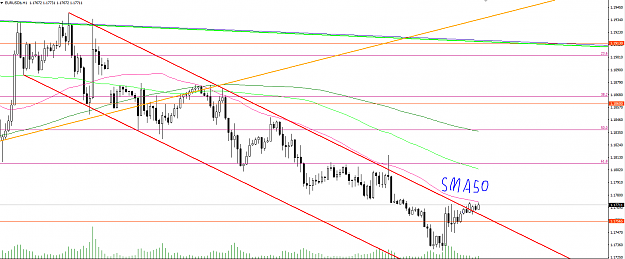
- Macpher replied Dec 12, 2017
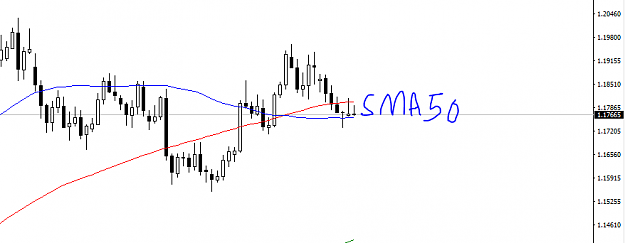
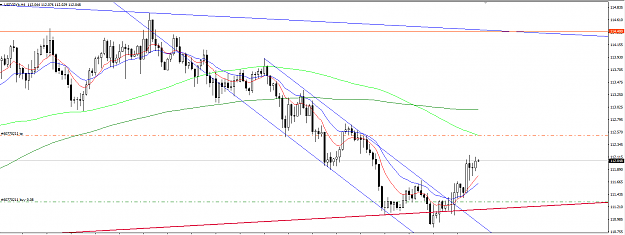
i think once it breaks through SMA 50 the price will resume downtrend
EURUSD
- Macpher replied Dec 12, 2017
i believe so too, a break of the resistance or support will send the price to that direction
USD/JPY Discussion
- Macpher replied Dec 10, 2017
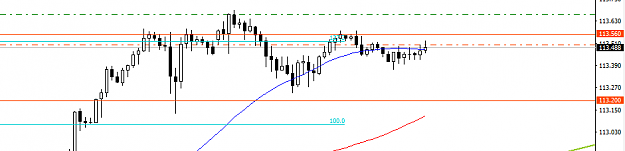
probably wait for the price to breakthrough SMA50 before making a long. Stay green!
EURUSD only
- Macpher replied Dec 10, 2017
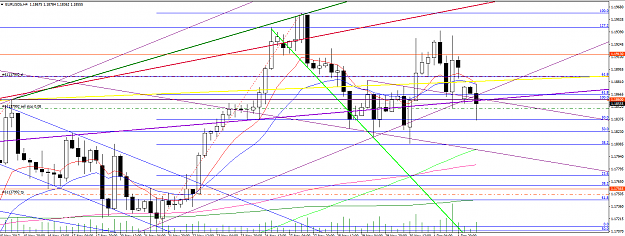
i see something like this in H1 chart tho, gonna see how it goes on monday opening before doing any trades. Stay green!
EURUSD
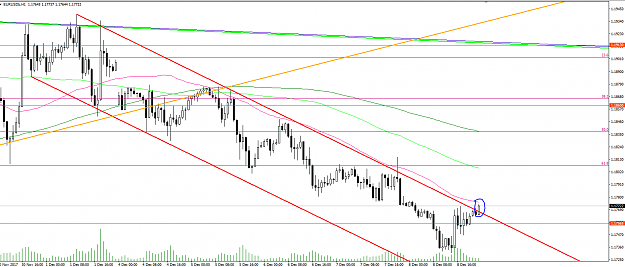
- Macpher replied Dec 9, 2017
same mate, seeing fibonacci level (one i set) is so close between the testing resistance line and support line, hopefully we will see some breakouts. cheers!
USD/JPY Discussion
- Macpher replied Dec 7, 2017
funny to see how everyone react to this market manipulators
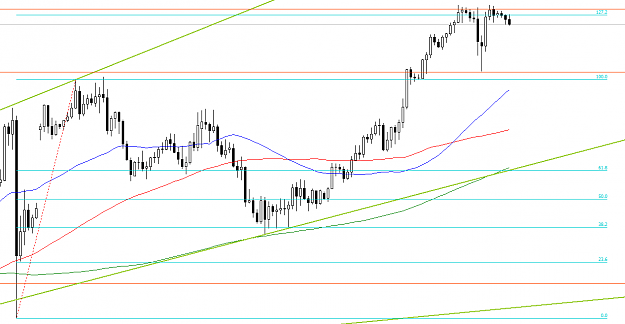
Cable Update (GBPUSD)
- Macpher replied Dec 6, 2017
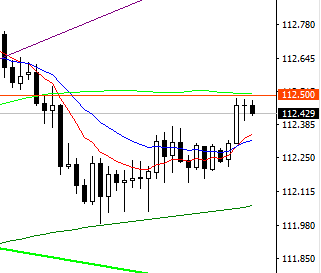
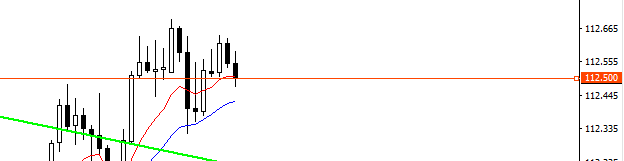
112.5 seems really strong, unless the pair breaks through, i hold off from buying for now
USD/JPY Discussion
- Macpher replied Dec 6, 2017
i think we're seeing some clustering, still no confirm side tho, but overall in D1 chart we do see a triple bottom.
EUR/GBP - What a great pair to trade!
- Macpher replied Dec 5, 2017
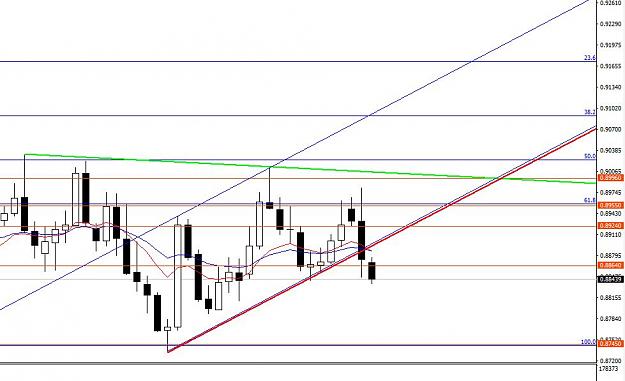
you might be right, alot of clustering in H4 chart, possible uptrend soon
XAU/USD & XAG/USD - Gold & Silver Traders Thread
- Macpher replied Dec 4, 2017
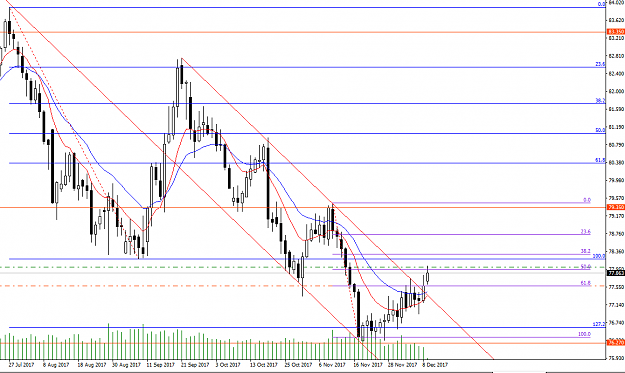
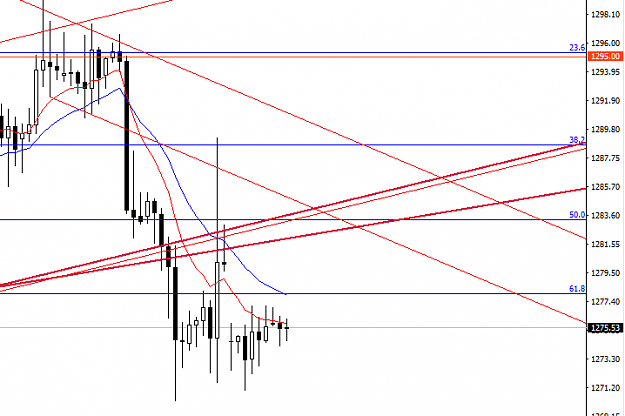
i see a double top setup, not really sure tho, but i'll short this for now and see how it goes.
EURUSD
- Macpher replied Dec 1, 2017
looks like the price is hanging around 112.5, will probably eye key level for a short run. cheers!
USD/JPY Discussion
- Macpher replied Nov 29, 2017
price breakout from channeling in H4, expecting it to hit 112.5
USD/JPY Discussion
- Macpher replied Nov 29, 2017
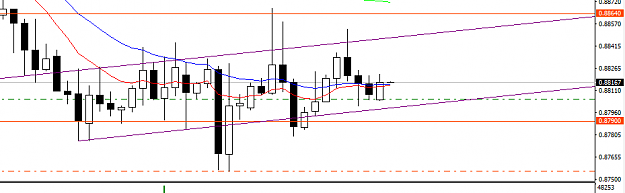
sold and tp at 0.88700 probably gonna wait awhile before second target to 0.88100
EUR/GBP - What a great pair to trade!
- Posts by Member Search: 'Macpher'