- Search Energy EXCH
- 15 Results

-
 LondonTrader replied Aug 3, 2009
Hi Turveyd, Congratulation on. Only a few of us can stay on this stage that long and practise - I will be one of them, but at least 2 or 3 mre years is in front of me so it is good to lisen story like yours or Chris. Thank`s for that Btw, do we have ...
Cable Update (GBPUSD)
- LondonTrader replied Aug 3, 2009
Hi Wormboy Can I ask you something? I know the day didn`t close but ATM, does the dialy chart looks like 3 soldiers formation or not really? If this is the case how often does it works as a reversal pattern? Thank you, LT
Cable Update (GBPUSD)
- LondonTrader replied Aug 3, 2009
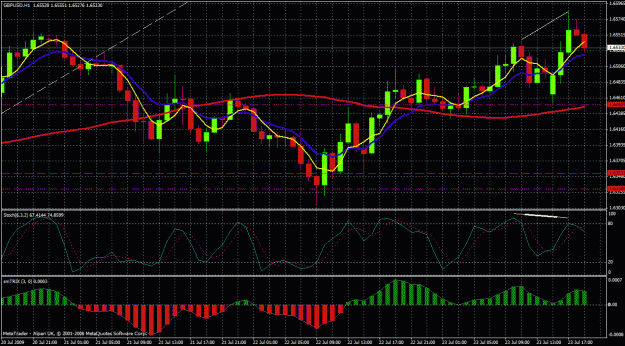
I am a little bit late but the shooting star on 1H chart plus the divergence between PA and MACD ... it droped down already but maybe it will came back to 6720 Just a tought LOndon Trader Some thimes a socond top is needed so we might wait for a ...
Cable Update (GBPUSD)
- LondonTrader replied Aug 2, 2009
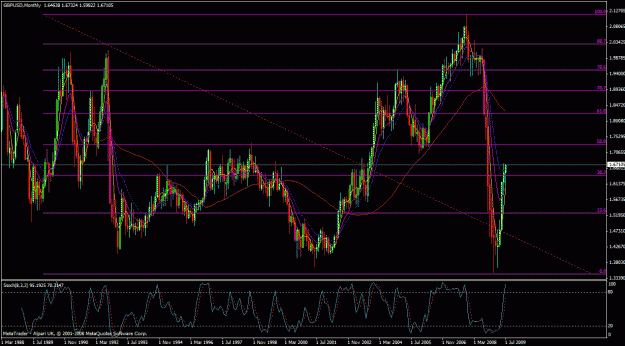
HI Matjaz I don`t know about this week but I watched a monthly/weekly charts and found out that over last 20 years periot GBPUSD was below 38.2% Fib grid and only 6 years above. More over only twice exeded 50% and in both cases return around 16090 ...
Cable Update (GBPUSD)
- LondonTrader replied Aug 1, 2009
Hi All, I did my research on monthly/weekly charts with FIB grid and dicovered 2 things. Over 20 years on this chart GBPUSD spend 14 years below 38.2 Fib and 6 years above, but when she was below only once exeded the 50% in December 2003 -only once ...
Cable Update (GBPUSD)

- LondonTrader replied Jul 24, 2009
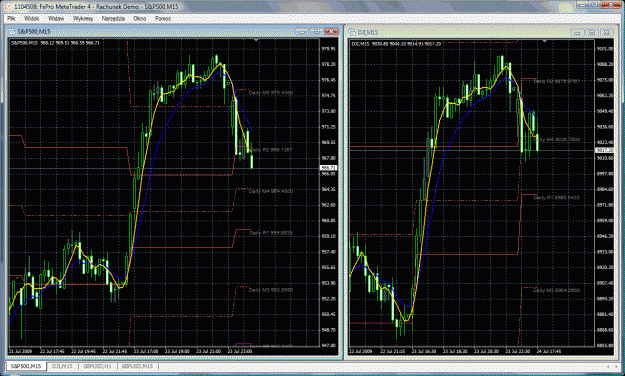
HI All, 4H with Bollinger (and yesterday divergence on it) shows down trend to (might) continue. The same with 15Minuts S&P500 and DowJhons...are sloping down Just a thought LOndon Trader
Cable Update (GBPUSD)
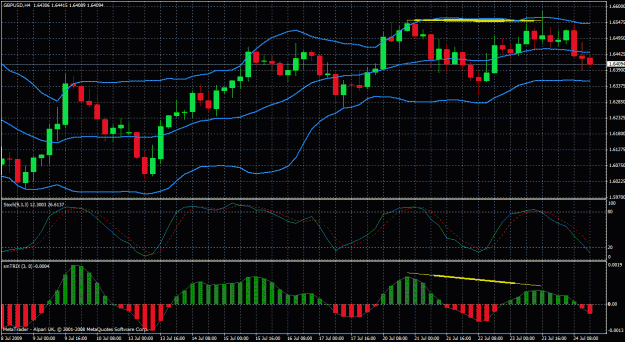
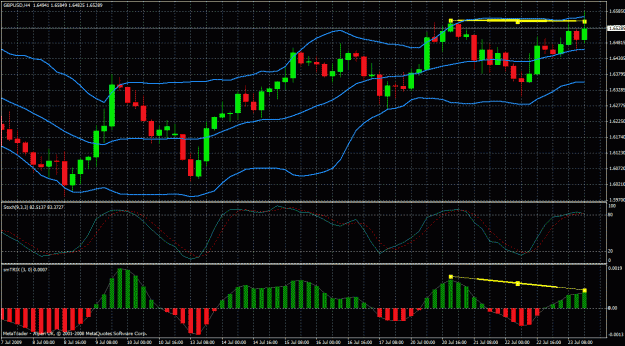
- LondonTrader replied Jul 23, 2009
We have a divergence on DAILY chart as well. I wonder how it works...and 4H with double top and top of Bollinger Band mentioned before Hm...any one has experiance with double tops on 4H charts and divergences...? How deep we can dive? if we can... ...
Cable Update (GBPUSD)
- LondonTrader replied Jul 23, 2009
Thx Mktjong 4H chart similar thought - plus it looks like double top with divergence as well, but who knows.... London Trader
Cable Update (GBPUSD)

- LondonTrader replied Jul 16, 2009
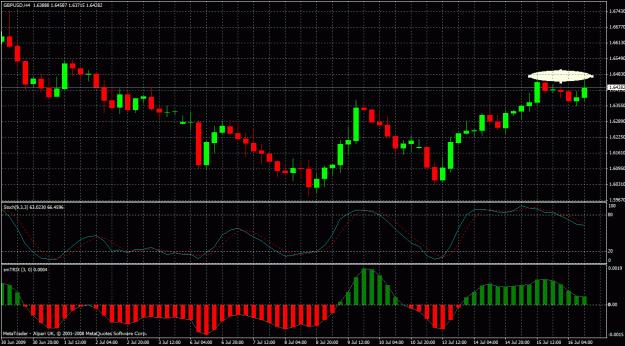
On 4H chart we have double top and divergence. Will it hold Her? and turn it south....? Just a question London Trader
Cable Update (GBPUSD)
- LondonTrader replied Jul 14, 2009
Hi Albrch, I cam back to you as soon as I could, so: I`ve chaked how it works from March and tried a few more set ups like 3 SMA or 2 SMA... also at 30 Minuts chart; 15 Minuts; 4 Hours and 1Hour. Only the 4SMA/9EMA gives best confirmation but not ...
Cable Update (GBPUSD)
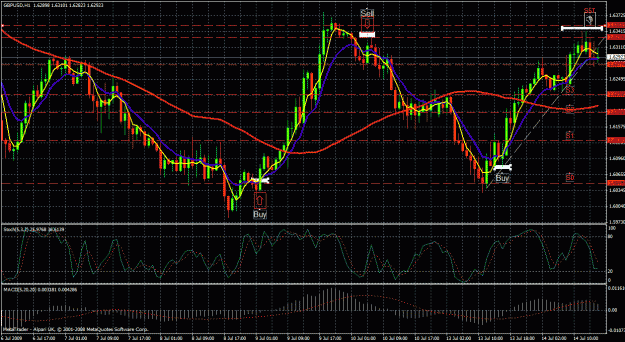
- LondonTrader replied Jul 14, 2009
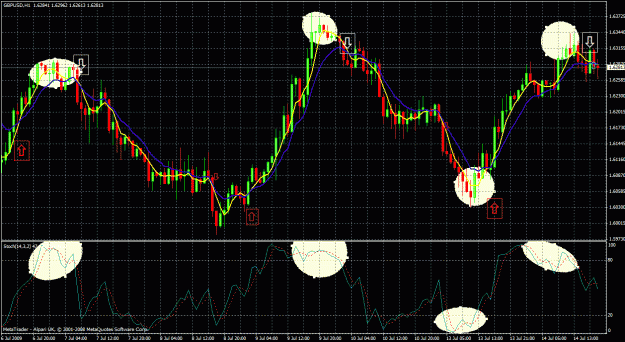
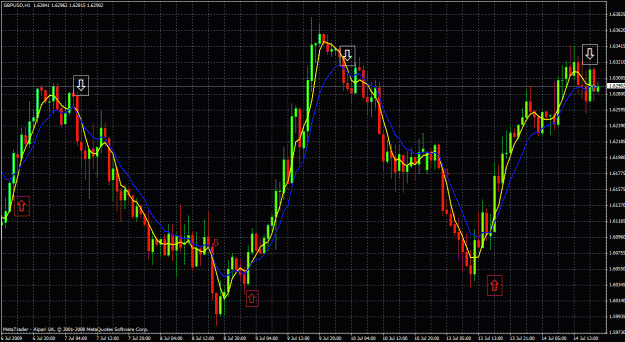
Hi, Take a look at history. On your 1H chart put 4 simple MA (yellow line on my chart) and 9 Exponential MA (blue line on my chart) Now when the yellow line cross the blue you have the confirmation where is SHE going (down or up) Then you can wait ...
Cable Update (GBPUSD)
- LondonTrader replied Jul 14, 2009
In my opinion you can get the same efect when you put 4 simple Moving Average on your chart and 9 EMA. Any time when the 4 SMA cross the 9 EMA is time to buy/sell. In my opinion it works the same as Sniper but I found this out yesterday. In my ...
Cable Update (GBPUSD)

- LondonTrader replied Jul 14, 2009
Maybe is prepering to go down. I am waiting for better entry. Is anyone using 4 SMA and 9 EMA for cross over? I made it up yesterday and it seems that on 1H chart work very good Any opinion on this? Londn Trader
Cable Update (GBPUSD)
- Posts by Member Search: 'LondonTrader'