- Search Energy EXCH
- 18 Results
- Leigh replied Jun 17, 2016
Can someone please Take the fib lines out of the indicator just leaving all the fib values showing onscreen.
I will code your EAs and Indicators for no charge
- Leigh replied Aug 11, 2013
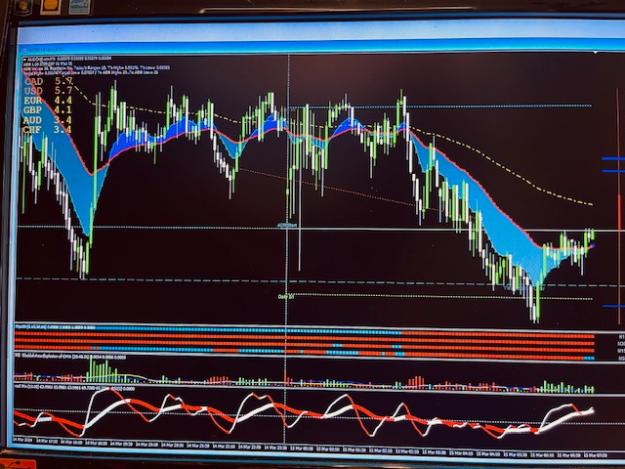
Here are my favorite indicators. See if they are useful to you.
Let's find your indicator-ebooks for mt4

- Leigh replied Feb 10, 2012
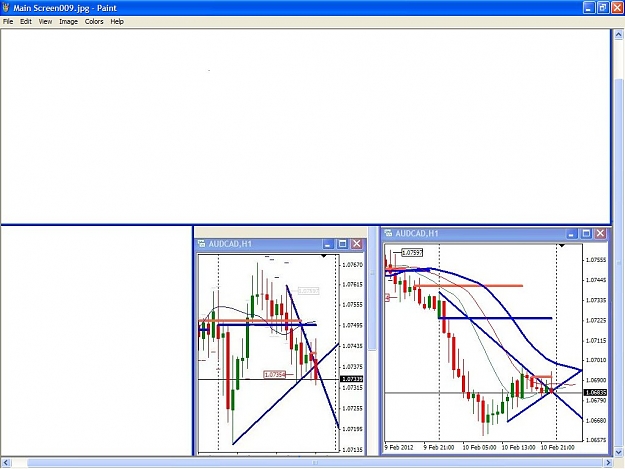
Missed a beauty here! — Hi I only came across this method a few days ago. I missed a beaut trade yesterday.
Simple Simon Balance Line Trading
- Leigh replied Oct 2, 2010
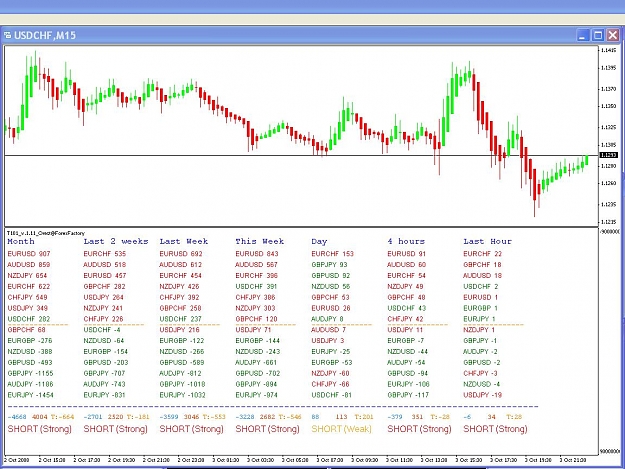
image Trade What You See - Almost Naked Trading THE CHART LOVERS METHOD I am starting this thread for those of us who love charts..watching them...studying them...analyzing them and of course, making money from them. My system is simple. It is a ...
Trade What You See - Almost Naked Trading
- Leigh replied Jun 29, 2010
Fractual Candles on Barchart. — Changed the properties from candles to Barcharts to take away the black candles.
ALF revisited - simple, effective daytrading
- Leigh replied Oct 5, 2008
Great Idea! But would it be possible to Have Orest's Awesome indicator with a white background. I have a problem trying to view it clearly on the thread and if everyone is going to post coments and screen shots and will be difficult to view and ...
Simple Trading Method with trader101
- Leigh replied Jun 14, 2008
Trendline Indicator. — [quote=MarkWhistler;2037228]Hey Everyone, Is this Trendline indicator helpful for your method?
Trend Analysis for REAL Traders
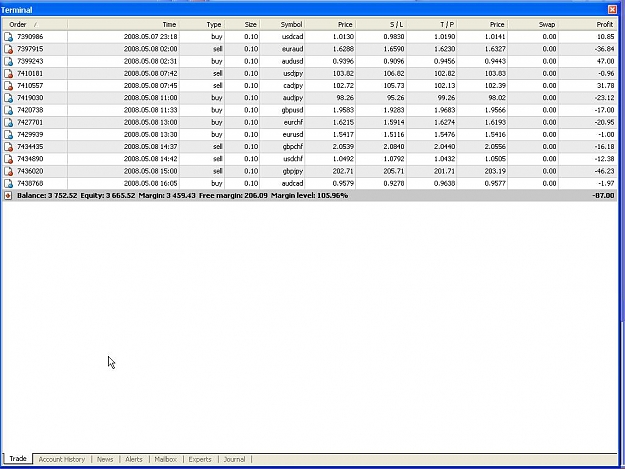
- Leigh replied May 9, 2008
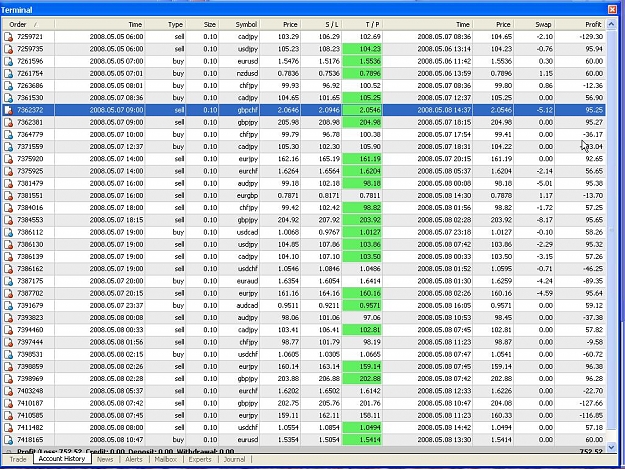
Results — Unfortunately I stopped my ODL $3000 Ultimate [3] on May 9 at 1250 EST. I opened it on Monday. Great results for just a few days! I was trying not to have a good win turn into a loss at the end of the week! But I missed the Big Moves ...
Simplicity is the Key
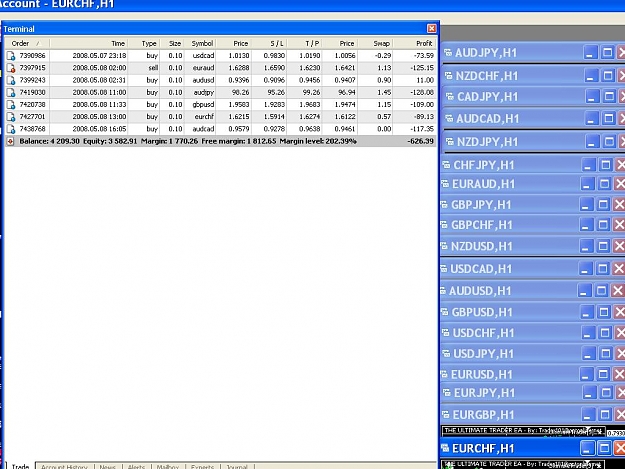
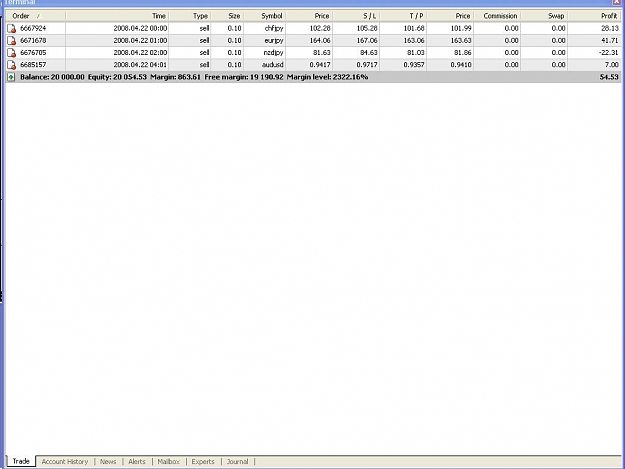
- Leigh replied Apr 22, 2008
Odl Demo. $20,000 17 Pairs plus Gold and Oil. GY, CadJ, EJ, AJ, CHFJ, NJ, NU, GU, GC, AU, EA, EC, EU, EG, UC, UJ, Gold, Oil, UCad. I had Ultimate 1 Running since about 1400 EST. EA opened trades as attached. Now running Ultimate 2 since 0135 EST. ...
Simplicity is the Key
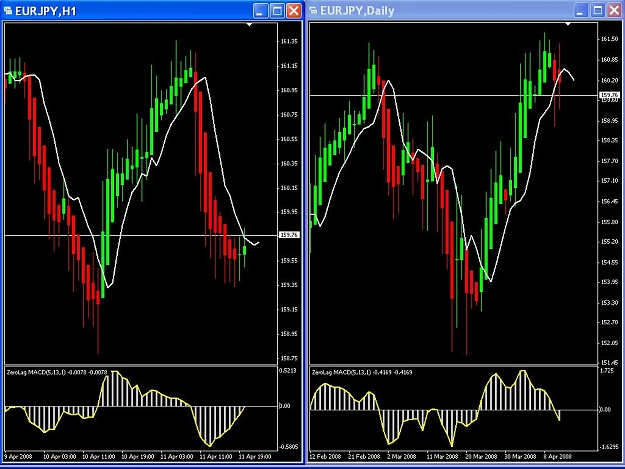
- Leigh replied Apr 12, 2008
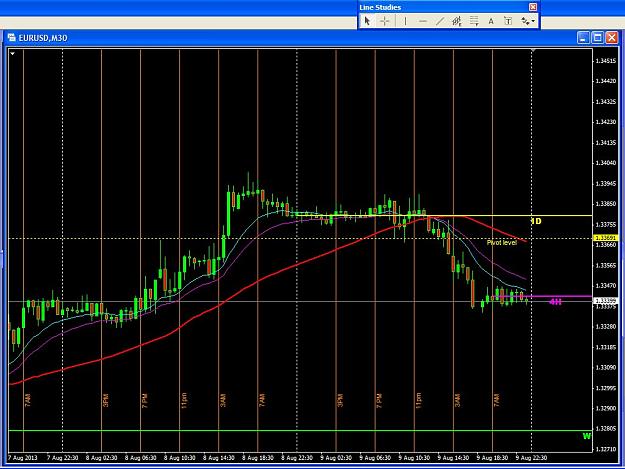
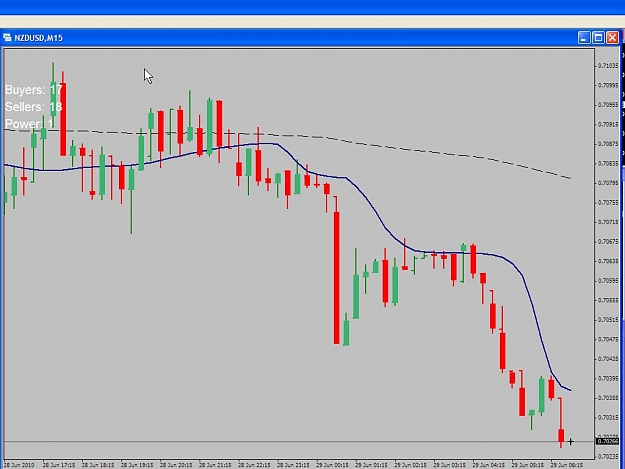
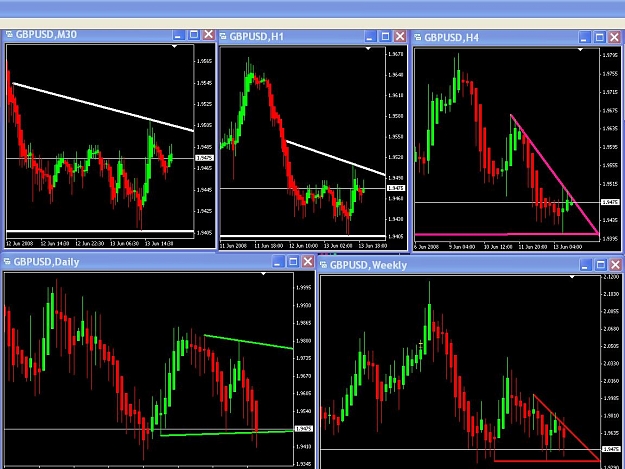
Trend. — This is my chart setup. I hope that it helps. Leigh.
Simplicity is the Key
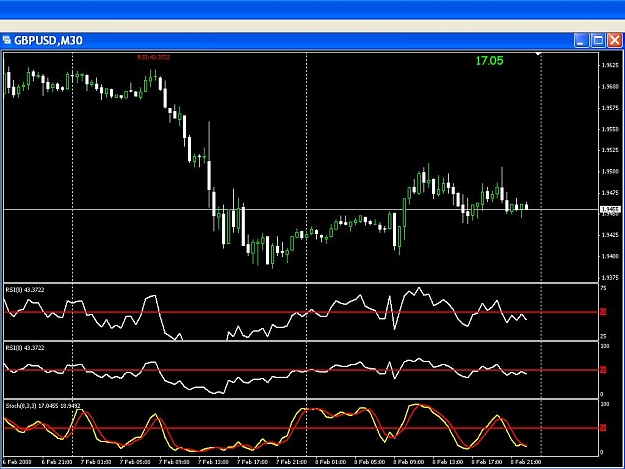
- Leigh replied Feb 10, 2008
Great idea. Here is a Stochastic indicator also that might give someone some ideas. It is basicaly the same idea. When stoc is above 80 or below 20 the value is shown DarkOlive Green. But above 80 and below 20 the value is Highlighted a Bright Lime ...
Custom RSI Indicater needed
- Leigh replied Feb 9, 2008
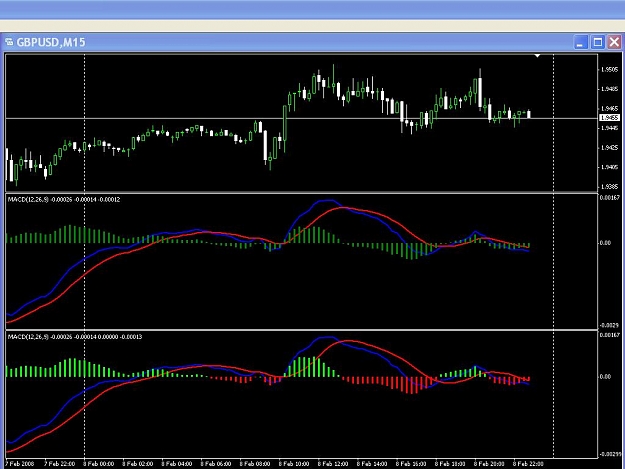
Macd alert — This one has an alert and seems very close to the "Real Macd " indicator posted. What do you think? Cheers.
The real macd.. not MT4's
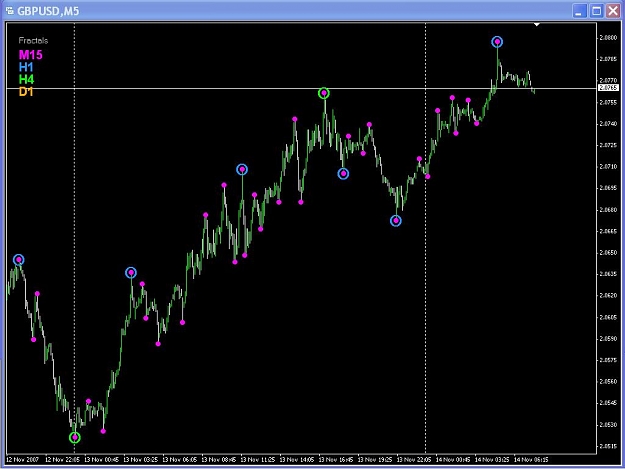
- Leigh replied Nov 14, 2007
Fractal indicator — Here is a Fractal indicator that shows the Fractals on different time frames if anybody wants it. Cheers. Leigh.
The System (Irony included)
- Leigh replied Sep 30, 2007
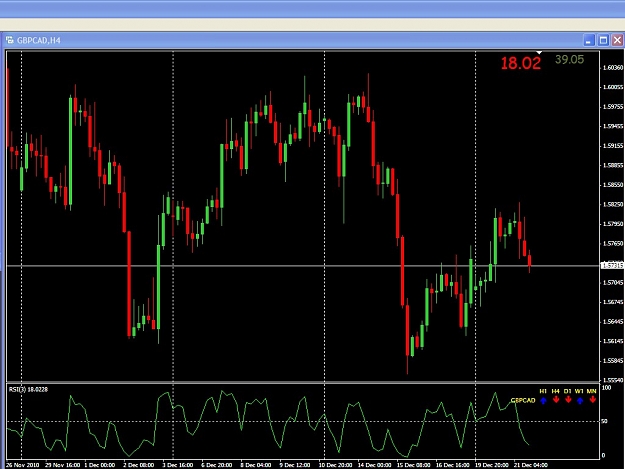
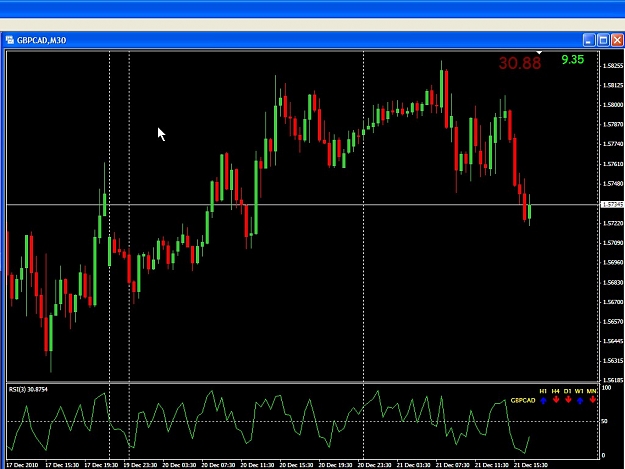
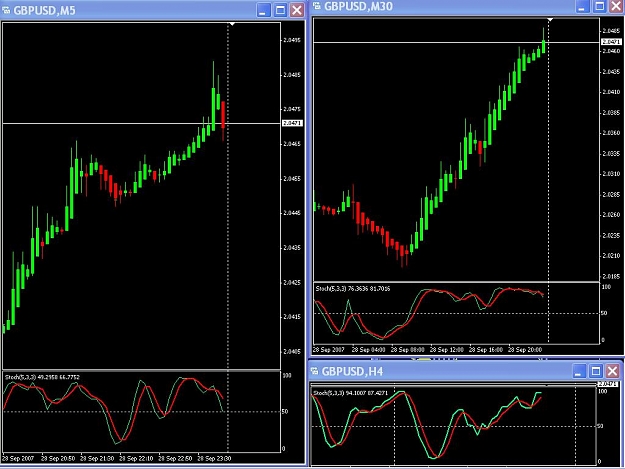
globalinvest Try setting the charts up so that you have a 4H chart setup up with only your stoc. in its own window below the 30M chart. Then it is a TRUE 4H Stochastic. A picture is worth a thousand words. Hope this helps. Leigh.
TEB sytstem
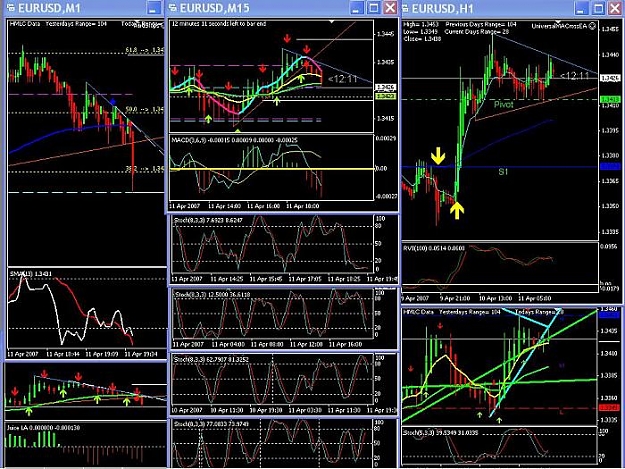
- Leigh replied Apr 21, 2007
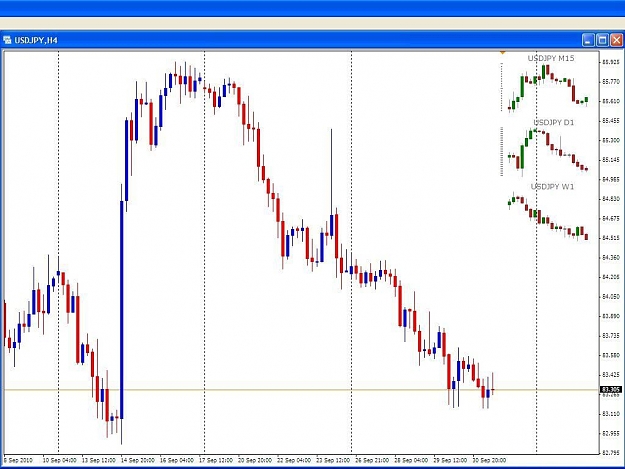
Viewing Stochastics on all timeframes. — This is how I view Stochastics on other timeframes to save valuable screen real estate. Charts are 1m through to 60m stacked on top of each other, showing just the lower window.
MTF Stochastics
- Posts by Member Search: 'Leigh'