- Search Energy EXCH
- 9 Results
-
 LearnAlways replied Sep 26, 2015
Hi CrucialPoint, I had been pondering on your post for some time but the idea didn't come on immediately, literally it took me days (non-trading days) when this sudden idea struck me. Pls help to clarify my thoughts and feel free to correct me if ...
A jump to the beginning - chaos and market forces


- LearnAlways replied Jun 7, 2015
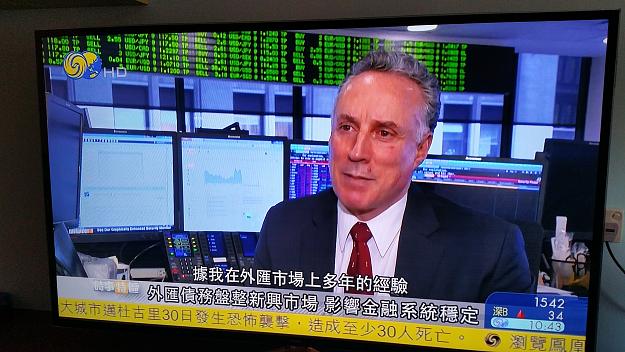
Hi All, image This is a pic I took while watching the news, saw there's information of BUY/SELL how many lots of Currency Pair @ what price / TP or SL. And the monitor doesn't really shows any indicators. Best Regards, LearnAlways
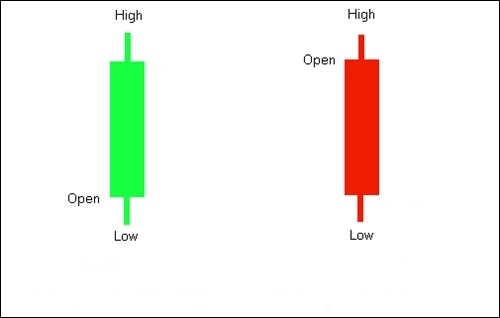
Higher Edge within a Single Candlestick
- LearnAlways replied May 12, 2015
Hi CrucialPoint, Can anyone pls explain what does all the numbers mean? I mean what information are on those numbers. I can only see Contracts, Last, Net, High, Low. And I'm not sure the top is Price? If anyone could enlighten me, I would be ...
Higher Edge within a Single Candlestick

- LearnAlways replied Apr 26, 2015
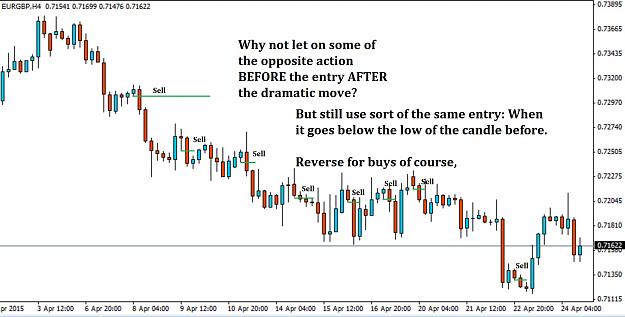
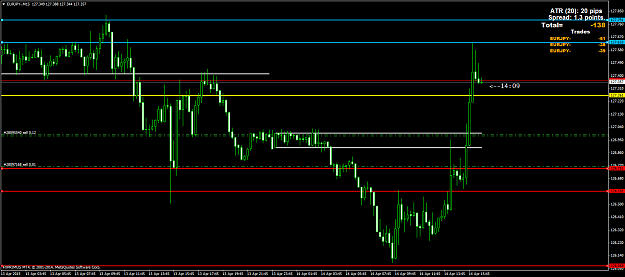
Hi yaed, Pls continue with more examples if possible, especially the latest discoveries u made (pls refer to attached pic). I saw u had made some changes to your profile, hopefully u are not being told by someone or some secret organization to shut ...
Want to know how to get rich?
- LearnAlways replied Apr 19, 2015
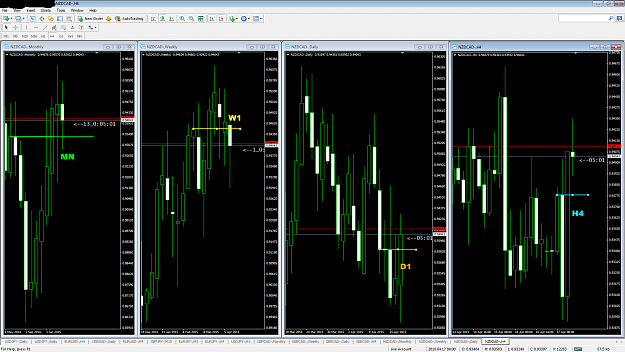
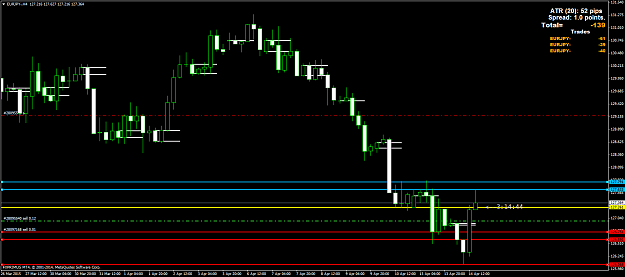
Thanks sunshine for your explanation, I asked because there are times in the monthly chart where there are no swings only slope line, so how should we trade, meaning the trend is very strong pls see attached pic. And I mean the risk is very high for ...
When Price is UP, buy; when Price is Down, sell short...
- LearnAlways replied Apr 19, 2015
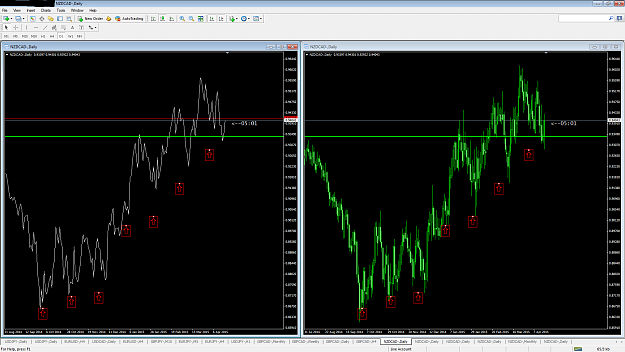
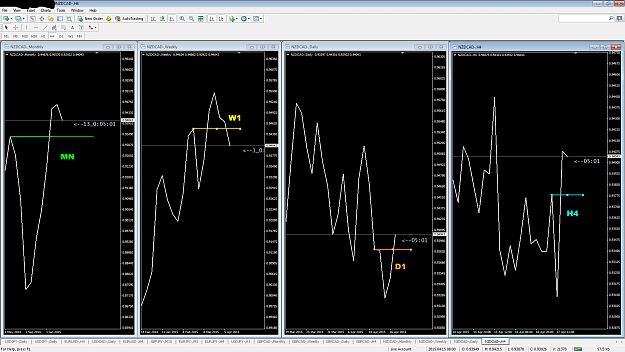
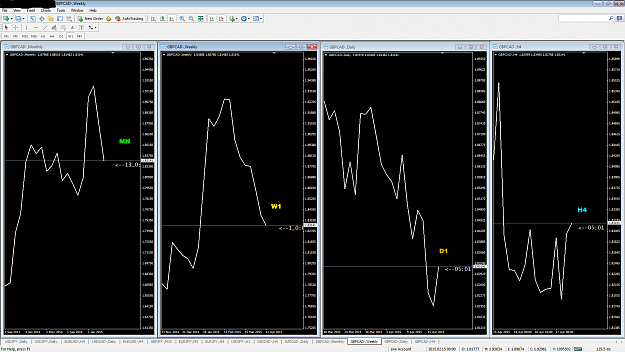
I mean based on LINE CHART NZDCAD THE MOST CURRENT SLOPE of the LINE chart is MN=DOWN, W1=DOWN, D1=UP, H4=UP. I understand what u mean by the LINE chart is above the most current swing High but the slope is currently still pointing down, shouldn't ...
When Price is UP, buy; when Price is Down, sell short...
- LearnAlways replied Apr 19, 2015
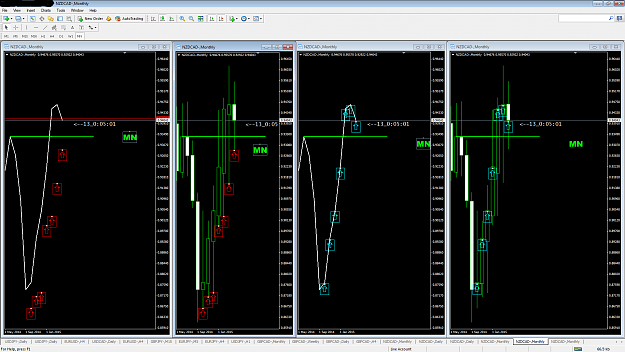
Hi sunshine, I am very puzzled as to why u said NZDCAD GBPCAD monthly Trend is Up, Weekly Trend is UP? From the LINE chart as what I perceived, NZDCAD GBPCAD, MN is DOWN, W1 is DOWN, D1 is UP, H4 is UP. Pls refer to attached pic. Edit: Sorry I ...
When Price is UP, buy; when Price is Down, sell short...
- LearnAlways replied Apr 14, 2015
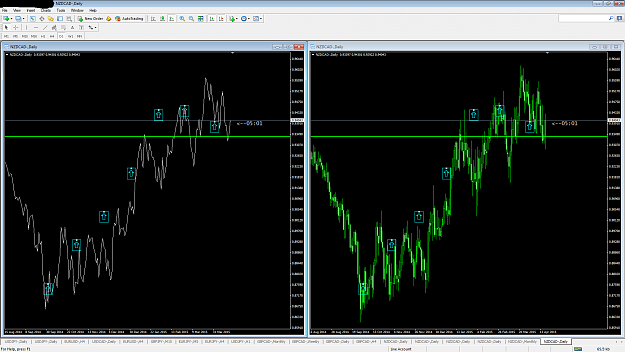
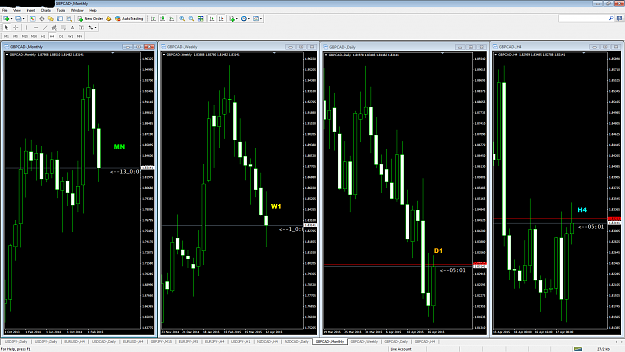
Pls see attached pic. I draw lines in 3 colors, Blue - Long, Red - Short, Yellow - Current Indecision Point. Based on price action we should decide when price react above the lines as per your teaching, pls feel free to correct me, thanks. White ...
Want to know how to get rich?
- LearnAlways replied Mar 16, 2015
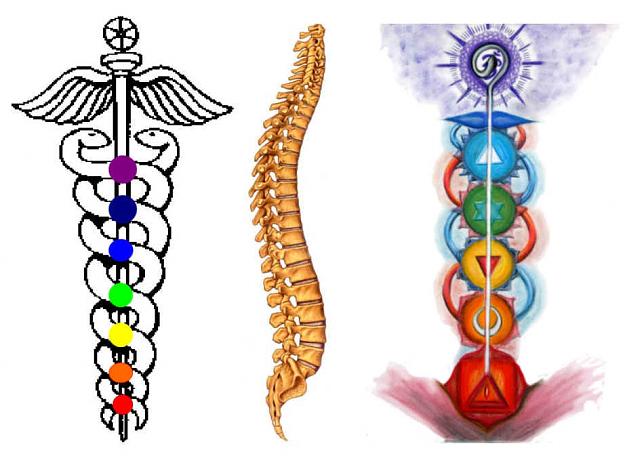
Hi mark72, I can see there are indeed some slight differences, so pls continue your thread as I would like to continue learning, "only time will tell". Double helix slight difference as in he drawn 2 lines in helix instead of 1 image image Sorry ...
You do not know how to trade

- Posts by Member Search: 'LearnAlways'