- Search Energy EXCH
- 20 Results
- Jmx replied Aug 20, 2010
Hi Mal, Nah no offence taken cos I am also learning.
vsa with Malcolm this is a chart showing the point when I go long with tight SL during then...( bottom picking ). As for the slow stoch I never add into this new chart cos during then is about to form not yet ...
- Jmx replied Aug 20, 2010
hourly lower volume test..... — 5 mins gu and hrly gu shows a lower volume test on the support had gone long with tight SL.
vsa with Malcolm If this is going up will be much higher then what we see as the slow stoch also shows hidden bullish divergence in ...
- Jmx replied Aug 18, 2010
Had long Gu at 1.5520 Sl at 1.5490 since a test is done will see how price move.
vsa with Malcolm
- Jmx replied Aug 4, 2010
Might be forming a H&S — There are rooms for more retracement....
vsa with Malcolm
- Jmx replied Aug 3, 2010
Gu 4 hrly chart — Hi guys did anyone notice the usually high volume in Europe/US session is at very low volume??? Was wondering how you guys interpret cos I see lack of demand and for daily there is a buying climax yesterday might be a turning ...
vsa with Malcolm
- Jmx replied Jul 23, 2010
GU chart — How come my daily chart on GU so diff from Bruceli??? I am using IBFX demo.
vsa with Malcolm
- Jmx replied Mar 30, 2010
still learning. — the hrly chart for GBPUSD looks like a markup b4 a dive. bearish volume divergence anyone can comments or i see wrongly??
Trade Using VSA (Volume Spread Analysis)
- Jmx replied Jan 28, 2010
bullish divergence in H1 — Euro short beware bullish divergence in H1.
EURUSD
- Jmx replied Aug 28, 2009
War Zone ?? — Hi Guys, I am new in this VSA system what I see there are 2 grp of people buying at 1.6265 and selling at 1.6310. So if to trade is it better to trade of out of this range or looking at bigger time frame to decide?? I saw the war ...
Trade Using VSA (Volume Spread Analysis)
- Jmx replied Jul 31, 2009
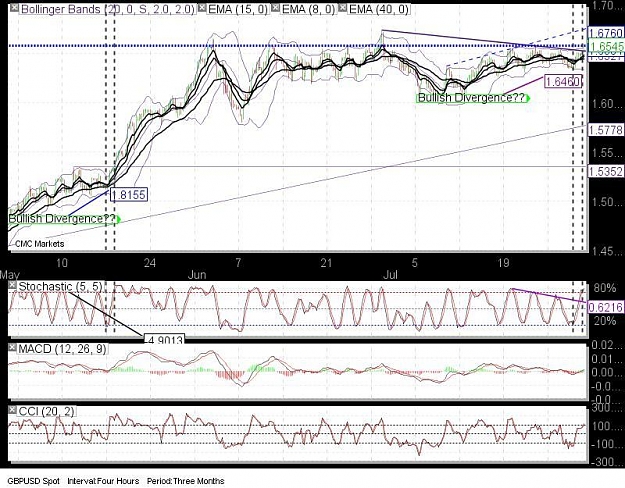
Bullish Divergence?? — Hi Guys, Need to confirm what I see, Can someone reply me of this chart?? Looks like a break up soon. Thks in Advance for those tht reply me
Cable Update (GBPUSD)
- Jmx replied Jul 29, 2009
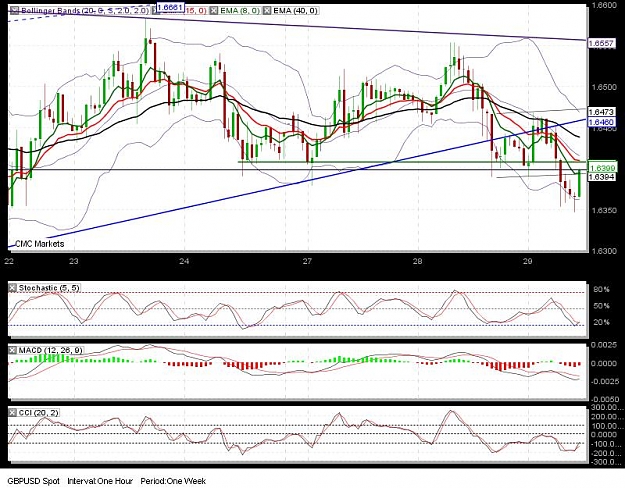
1 Hr small H&S?? — Hi, Did anyone notice the H&S in 30 mins, and 1 hr chart?? looks like testing back the neckline before back down.
Cable Update (GBPUSD)
- Jmx replied Jun 16, 2009
hrly euro chart — this is my hrly euro chart
Powerful Fib Based System - by DAZfx
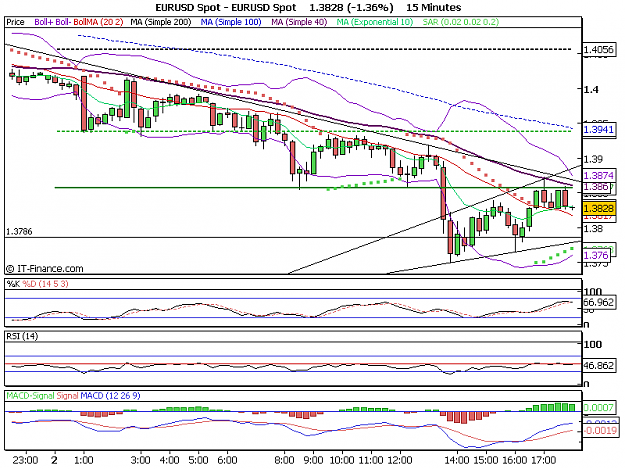
- Jmx replied Jun 16, 2009
hi guys — Hi, I just started using fibo and realise here got people using fibo and wave syatem just to double chk tht mine chart is correct telling me tht euro is going north after a retracement. Pls comments thks cause i am still learning.
Powerful Fib Based System - by DAZfx

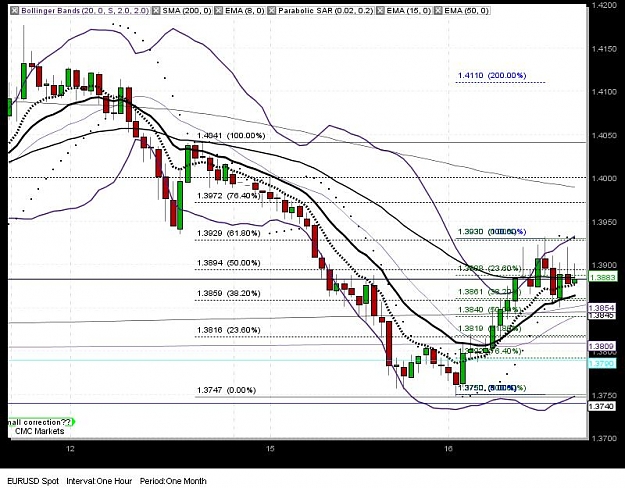
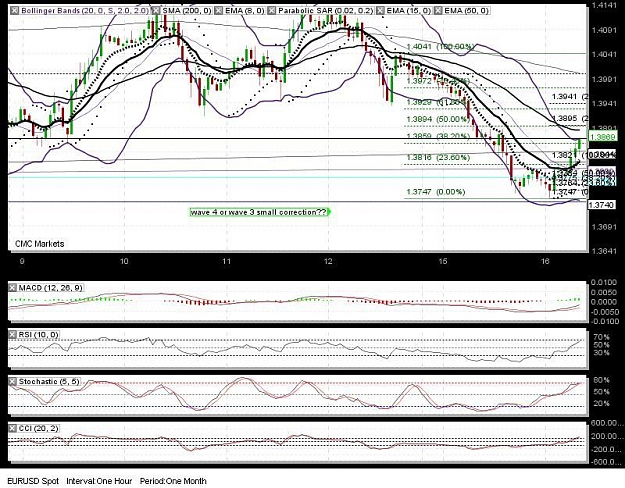
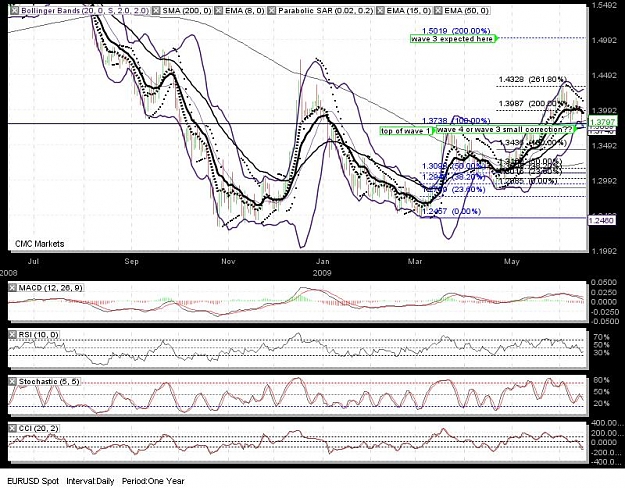
- Jmx replied Jun 16, 2009
Short or Long??? — Hi guys, Had been reading the post.. It is very nice from the view you guys had mention. Is anyone here follow fibo?? I currently looking at the 4 hrly and daily chart shows tht wave 4 had end and now is wave 5 or the ...
EURUSD
- Jmx replied Oct 2, 2008
Hi algirdas, Is it due to the wedge formation?? Trying to learn. Regards
EURUSD
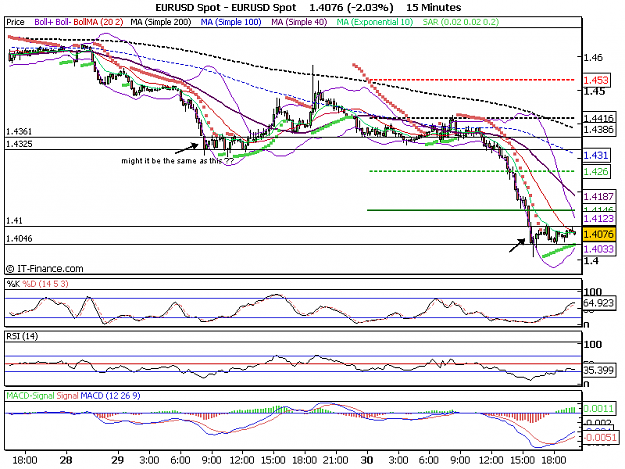
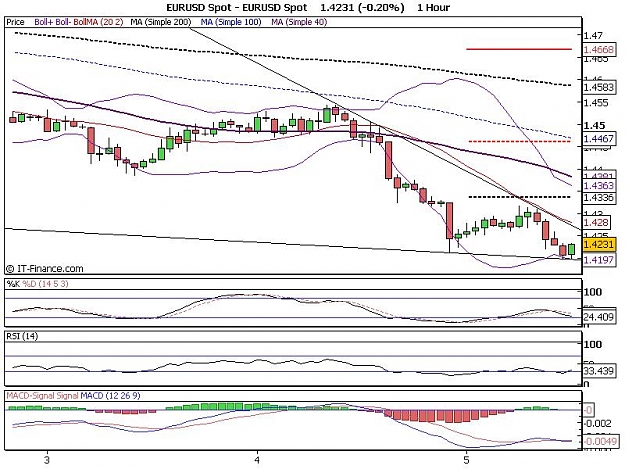
- Jmx replied Sep 30, 2008
looks like the same pattern.... — HI Psiholog, Might this going for a retracement?? As my indicator for MACD 30mins and 1Hr TF shows over sold as well as RSI. Thus might it be???
EURUSD Regards
- Jmx replied Sep 5, 2008
Might It goes up and come down?? — Hi Jurrasic, My horly chart show a wedge, like to seek you guys confirmation. will it hit the upper trend line and from there bounce down as in breakout.
EURUSD Thanks and regards
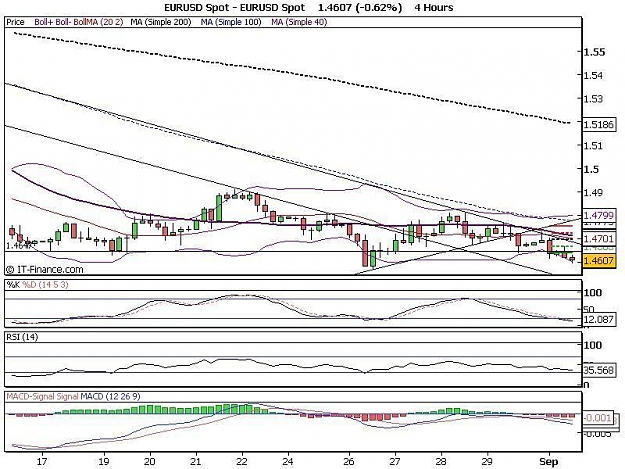
- Jmx replied Sep 1, 2008
Hi Cobra, this is my chart for 4 hrly the down trend still in tacts Regards
EURUSD
- Posts by Member Search: 'Jmx'