- Search Energy EXCH
- 9 Results
-
 Jer21 replied Nov 29, 2013
I appreciate the offer but I know most of those theories your trying to teach. I don't like fibs because its a hit or miss tool, I use another concept to gauge strong support/resistance levels. All you really need is volume and price. The 0.9050 ...
The ART of trading by Petar_Serbia
- Jer21 replied Nov 28, 2013
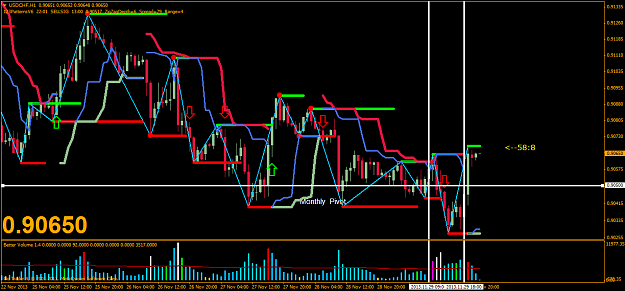
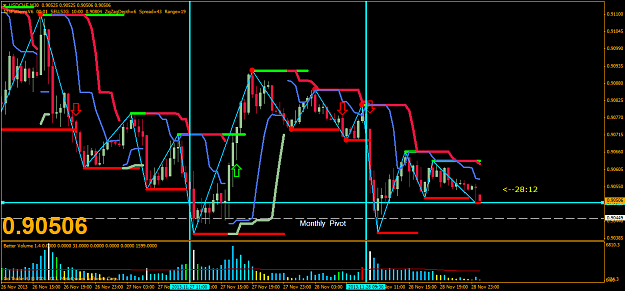
I have one question though, how would you differentiate a topping/bottoming formation vs. just a corrective phase? Because has you said buying/selling volume can also form at corrective tops/bottoms. For example, USDCHF 30min chart. Since selling ...
The ART of trading by Petar_Serbia
- Jer21 replied Nov 27, 2013
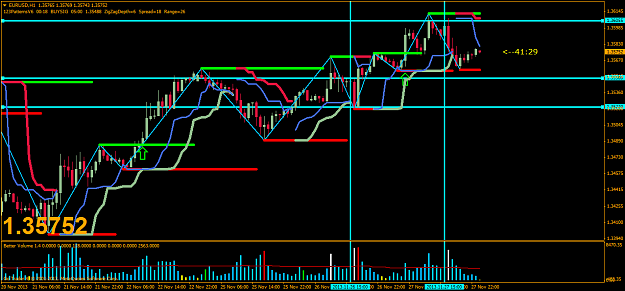
For example, EURUSD 1hr chart Since the sellers were rejected at 1.3522 and price rose to 1.36055 but also found major sellers. Would you consider buying around 1.355? of course I would like to see major volume at that area before I take action. ...
The ART of trading by Petar_Serbia
- Jer21 replied Jan 28, 2012
Hey bkg102665, How would you handle a trade like this? Bullish candle crossed on the 24th. Where would enter and place your stop? Do you have a technique to filter out trades? or conditions to be met before entering? I'm interested in your detailed ...
Daily Chart w/ 10sma
- Jer21 replied Jan 27, 2012
I have it plotted on the daily, I just post my 4hr chart so others could see a where I enter with minimal risk exposure. Once the daily candle closes above/below the 10sma, I look for 4hr fractal to be broken convincingly for confirmation that its a ...
Daily Chart w/ 10sma
- Jer21 replied Jan 25, 2012
I was just wondering where you would enter. Most of the time I would wait for the fractal to be broken. But if price is making lower/lows and I would enter @ 61.8
Daily Chart w/ 10sma
- Jer21 replied Sep 30, 2011
It simply amazes me how convergence of Gann angles and Fibonacci ratio works like a charm!
Gann Take Profit Levels
- Posts by Member Search: 'Jer21'