- Search Energy EXCH
- 22 Results
-
 Jenks_fx replied Apr 4, 2011
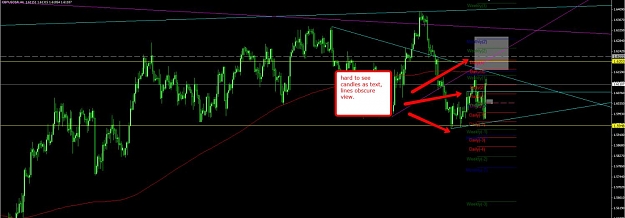
Hi Ray, To clarify... If I initially put it on GU 15M for example, then when I switch to the H1, H4, D1 etc...for GU, it is also shown there. When it's also shown on other TF's, eg H4, D1, it makes it more difficult to see the actual candles on the ...
FOREX Market Reversal Levels
- Jenks_fx replied Nov 12, 2010
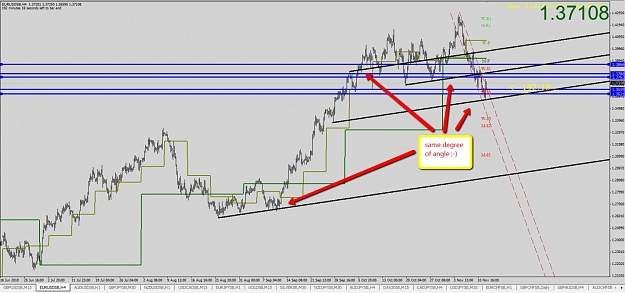
It's all about using the same ANGLE — See for yourself...
Pro Swing Trading Cheers, Jenks.
- Jenks_fx replied Nov 6, 2010
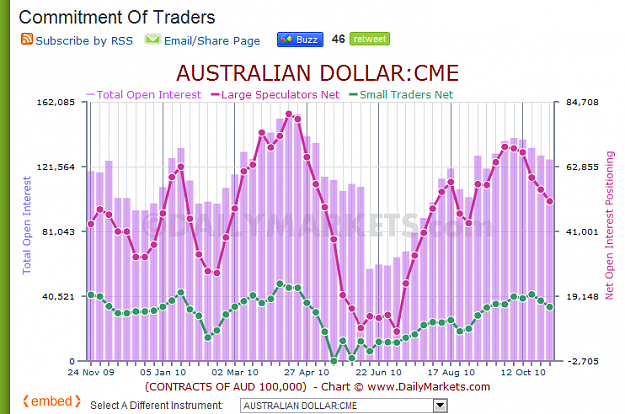
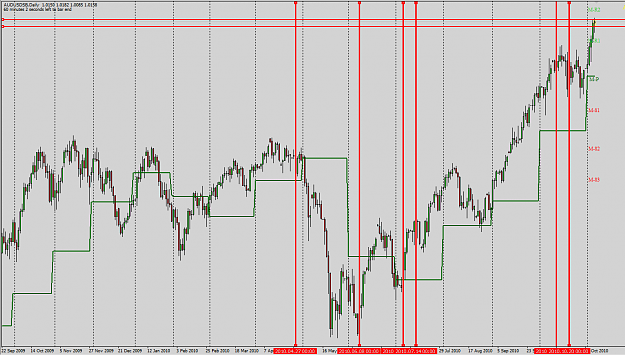
AU COT REPORT — Check this out..a similar viewpoint to MarcVUM Chart 1 shows the COT report for AU. You can clearly see the large speculators offloading and where we are now shows they've dropped from 69k to 51k open interest. Chart 2 shows ...
Weekly COT report Analysis + Trade Ideas
- Jenks_fx replied Oct 29, 2010
Daily — Daily could also be an interesting scenario.
Backing Trades Thru Charts
- Jenks_fx replied Oct 22, 2010
u/Chf — Maybe a confluence with TLC's H&S...
Backing Trades Thru Charts
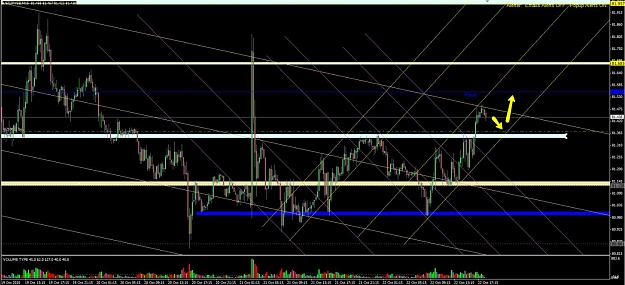
- Jenks_fx replied Oct 22, 2010
U/Yen — What channel are you tuned in to? I'm on the yellow channel. The b/o was stopped at UTL channel, for the time being. It may retest support (white line) before continuing north. EOW and Start of Next Week activity hopefully doesn't ...
Backing Trades Thru Charts
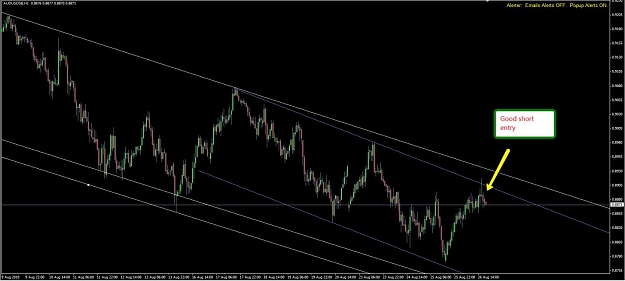
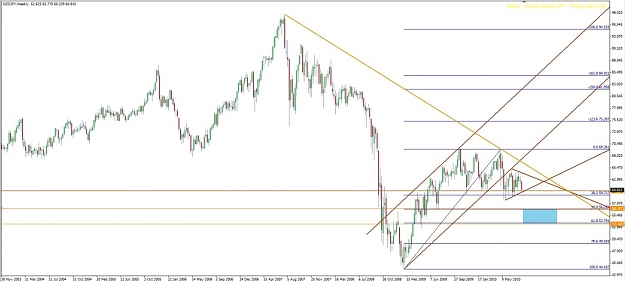
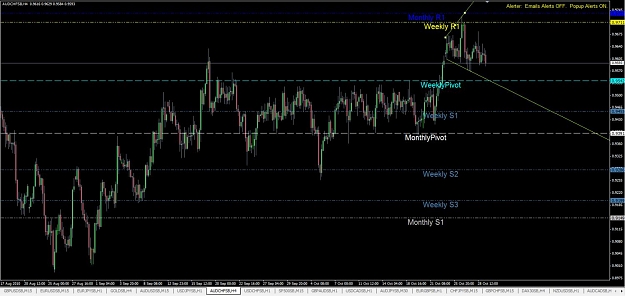
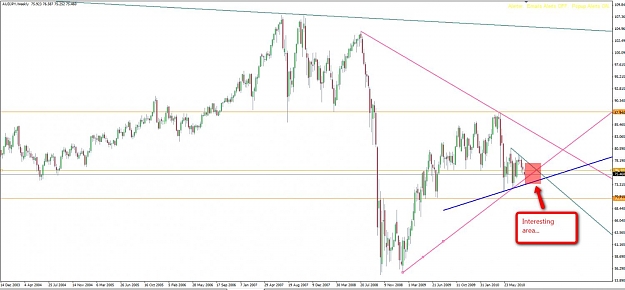
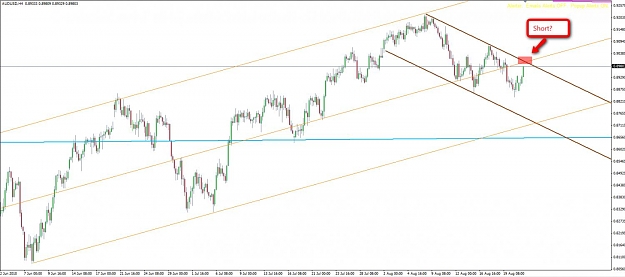
- Jenks_fx replied Aug 24, 2010
AUD/JPY Weekly — Interesting area coming up...
Backing Trades Thru Charts
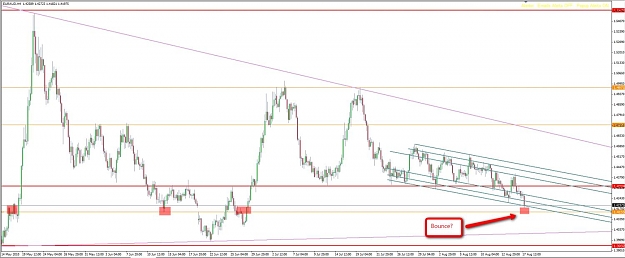

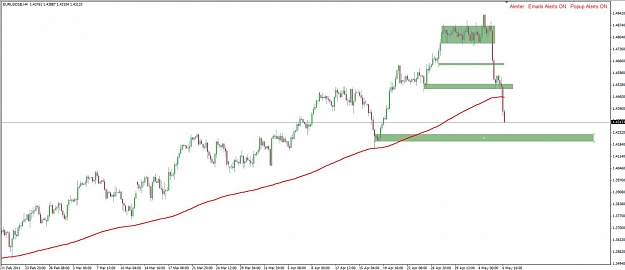
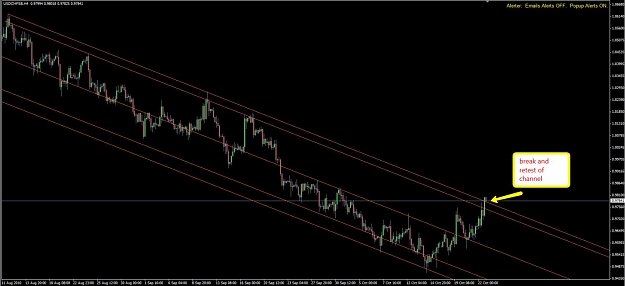
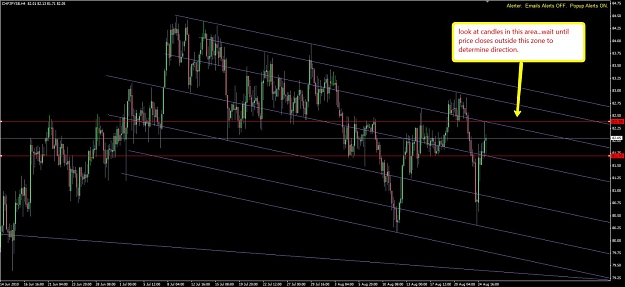
- Jenks_fx replied Aug 15, 2010
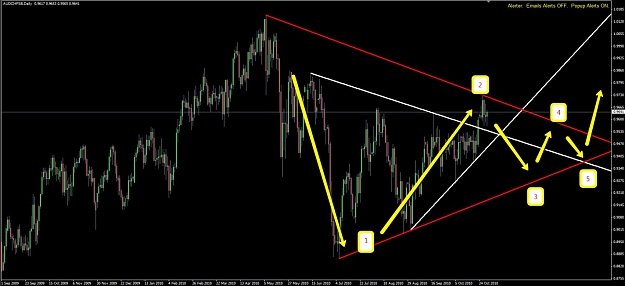
CAD/CHF Weekly — Decision Time...Bounce or Break
Backing Trades Thru Charts
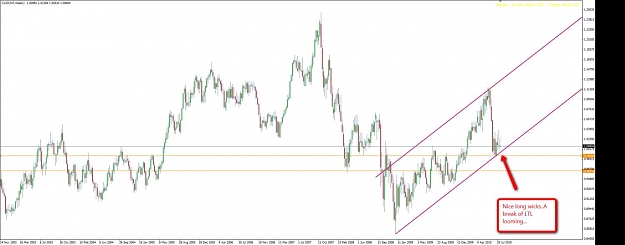
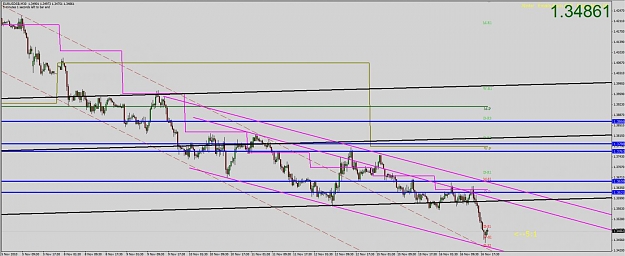
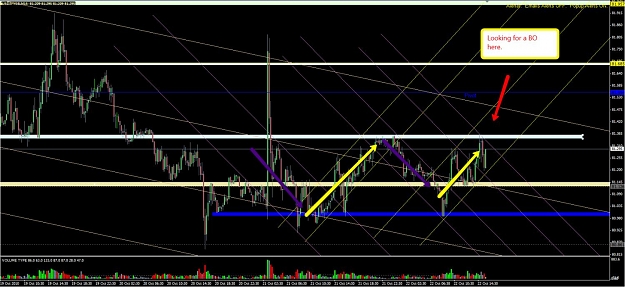
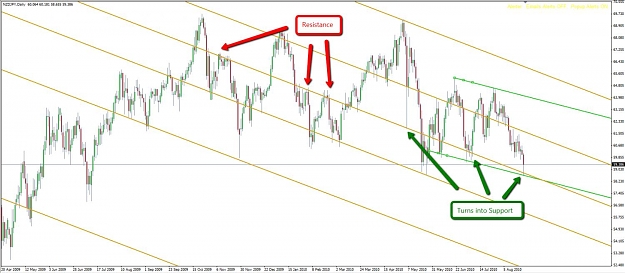
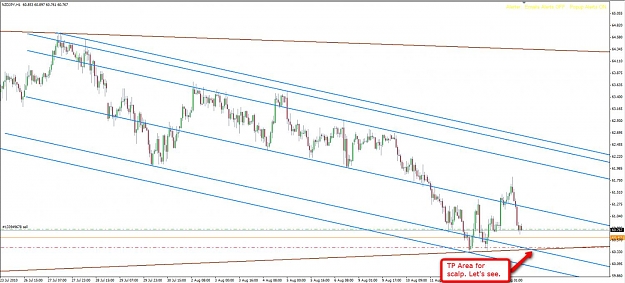
- Jenks_fx replied Aug 13, 2010
NZ/JPY H1 — - Drilling Down to H1... Measured move down.
Backing Trades Thru Charts
- Jenks_fx replied Aug 13, 2010
Great chart TLC. It's like an inverted flag. Support also at the blue area highlighted.
Backing Trades Thru Charts