- Search Energy EXCH
- 19 Results
-
 JayDavis replied Feb 4, 2019
Bear in mind that I am still studying the resource material. The main task or goal of the market is to find a price that facilitates trade. An auction works by finding a price where buyers and sellers agree on value. When supply exceeds demand price ...
The Hardest Way to Trade: Context Trading
- JayDavis replied Jun 22, 2018
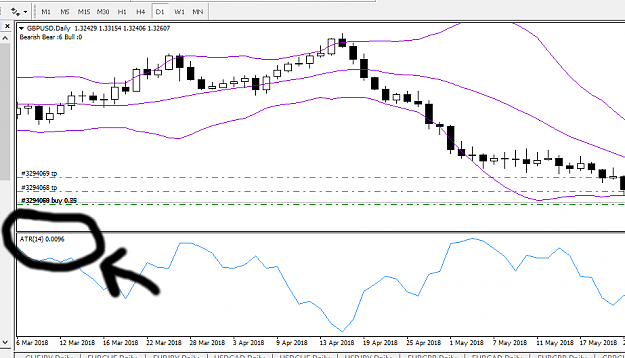
I simply take the ATR(14) value and add or subtract it to my opening price and use it as a take profit. For example. For the buy on GBPCHF yesterday the ATR(14) was 0.0082 and my opening price was 1.31255 so my first take profit was 1.32075 ...
Jay's Candle Sticker System
- JayDavis replied Jun 21, 2018
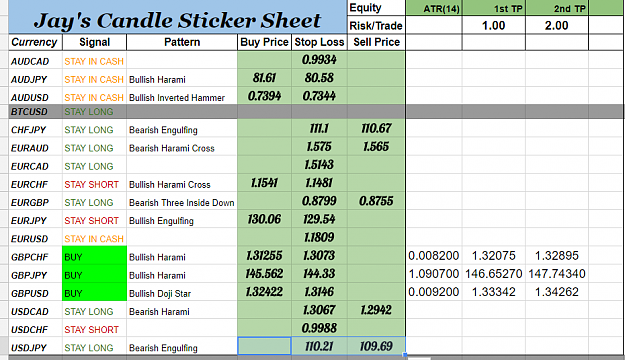
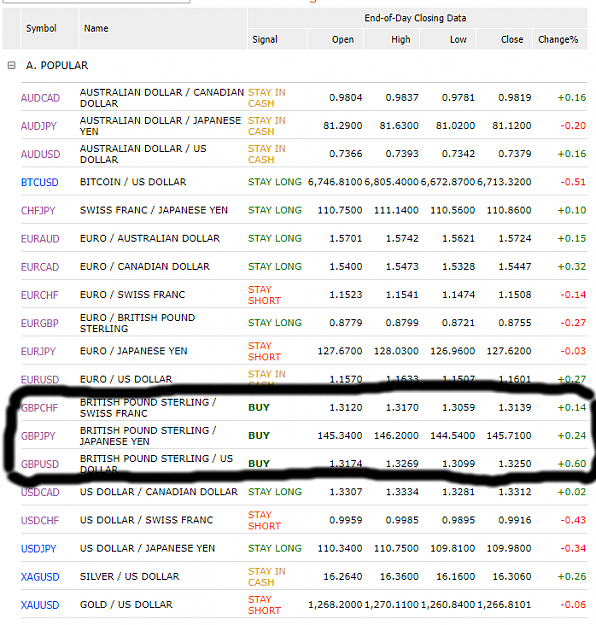
image url GBPJPY BULLISH HARAMI GBPJPY BULLISH HARAMI GBPUSD BULLISH DOJI STAR Three buy orders today.
Jay's Candle Sticker System
- JayDavis replied Jun 18, 2018
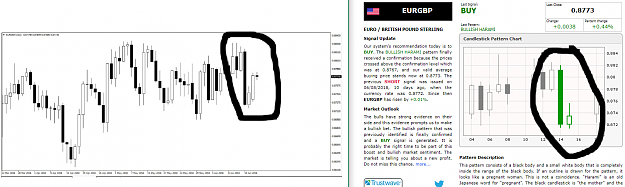
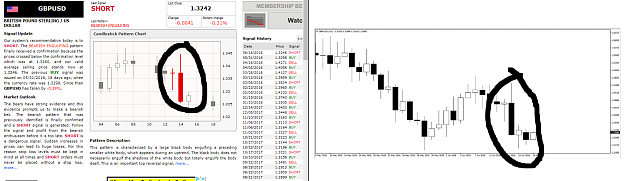
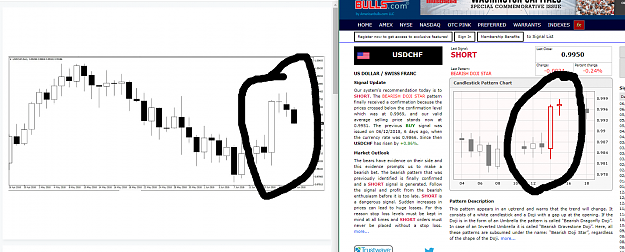
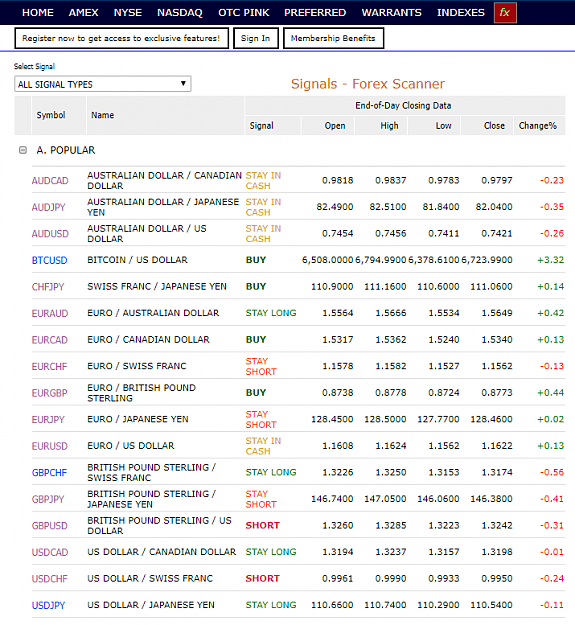
Five new trades according to Jay's Candlesticker system. url CHFJPY - buy, bullish doji star EURCAD - buy, bullish engulfing EURGBP - buy, bullish harami GBPUSD - short, bearish engulfing USDCHF - short, bearish doji star image I plan to execute ...
Jay's Candle Sticker System
- JayDavis replied Jun 15, 2018
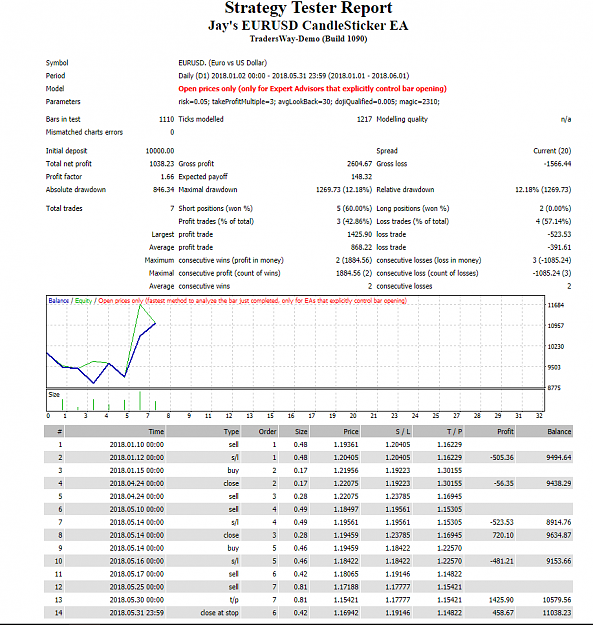
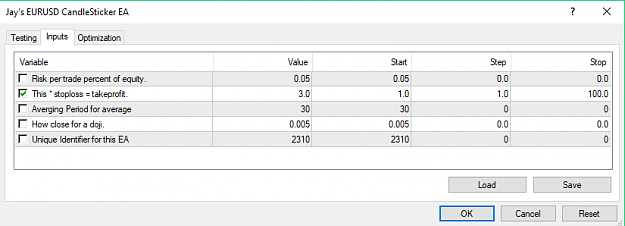
A small effort at automating the system on the EURUSD pair. This EA is simplified from the main strategy in a few ways. 1. Stop-losses are actually set and applied. 2. Take profits are a multiple of stop-loss. 3. Lot size is determined by a ...
Jay's Candle Sticker System
- JayDavis replied Jun 14, 2018
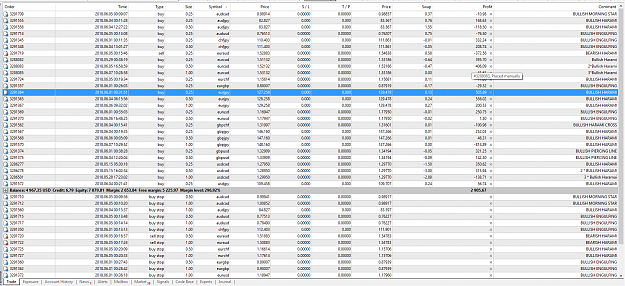
image So, after much study, we figured out that BUY means a buy order was placed and SELL means an order was closed. While Short means that a sell order was placed. If a Short follows a buy then the buy was closed and a sell order was opened. If a ...
Jay's Candle Sticker System
- JayDavis replied Jun 10, 2018
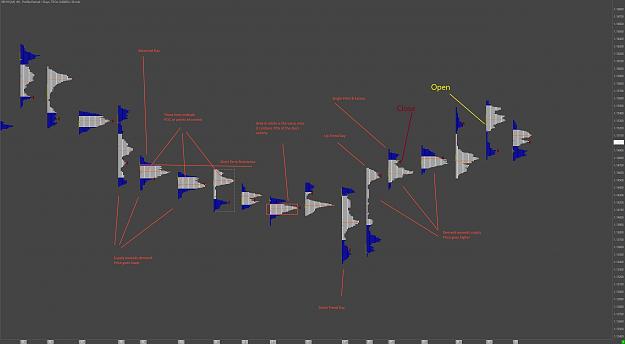
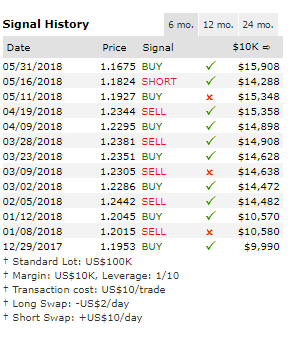
New orders from Sunday Evening. So the account doubled from its lowest point on Friday so the girlfriend rule was initiated. I closed all positions. That being done, I looked to see what new candlestick patterns were confirmed. I took two trades. A ...
Jay's Candle Sticker System
- JayDavis replied Jun 9, 2018
Yep, unfortunately I did upload some zip files to this thread that contained that data for one moment in time though. Here is EURUSD from Friday 6/8/18 image
Jay's Candle Sticker System
- JayDavis replied Jun 9, 2018
image Sure, bear in mind that you do not place the stop-loss on the chart. This sentence explains the mechanics about when to close the trade if it goes beyond the stop-loss. Also, keep in mind that you are only making decisions once a day for 15 ...
Jay's Candle Sticker System
- JayDavis replied Jun 8, 2018
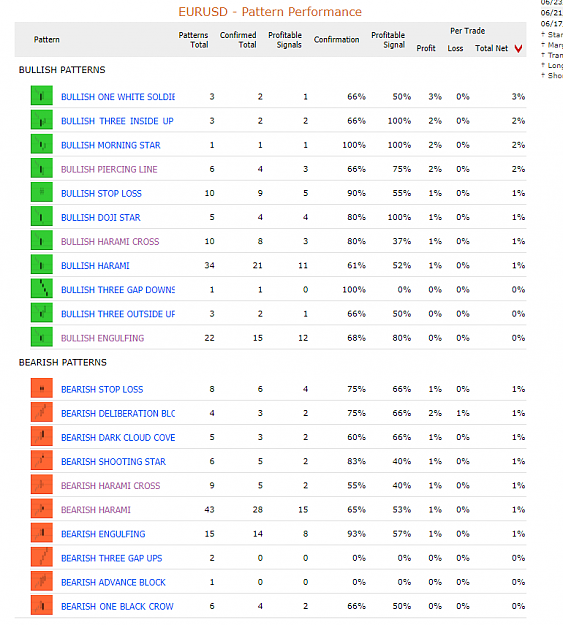
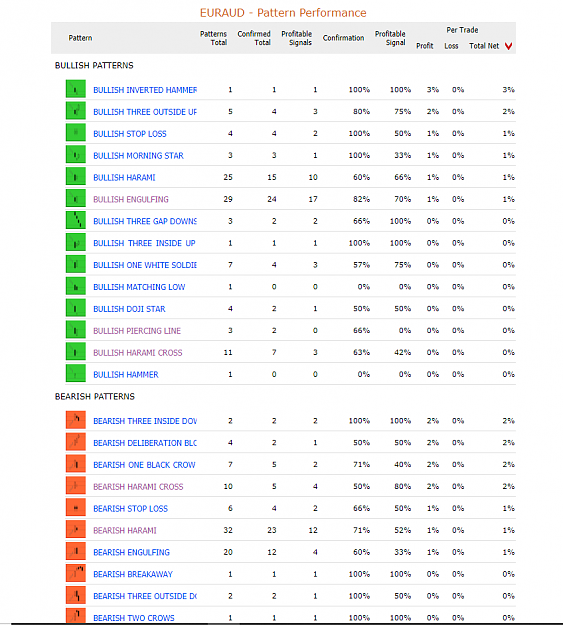
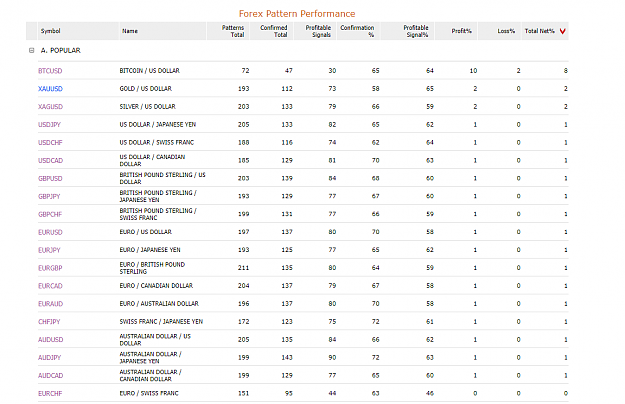
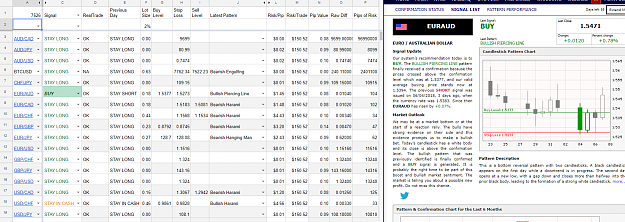
Ok, think I have figured out what you need. Here is the pattern performance for EURAUD image You could probably just use the ones that result in a 1% gain or more. There is a different sheet for each currency pair that they track. and here is ...
Jay's Candle Sticker System

- JayDavis replied Jun 7, 2018
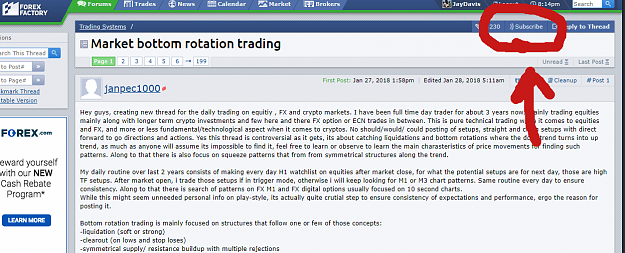
Do you see this when you click on a thread? Ahem added this blurp for the google searchers. How to subscribe to a forex factory thread. How to subscribe to a forex factory forum. How to subscribe at forex factory. image
Jay's Candle Sticker System
- JayDavis replied Jun 7, 2018
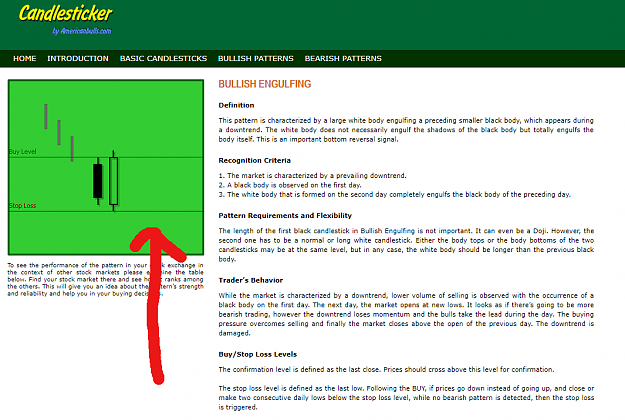
Ok, it's after 5 pm Eastern and I have checked for candlestick patterns I have one valid trade. EURAUD formed a Bullish Piercing Line on 6/5/18 which confirmed today. Buy Level 1.5377 Stop Loss 1.5273 Execution at 1.54767 Before I can initiate this ...
Jay's Candle Sticker System
- JayDavis replied Jun 7, 2018
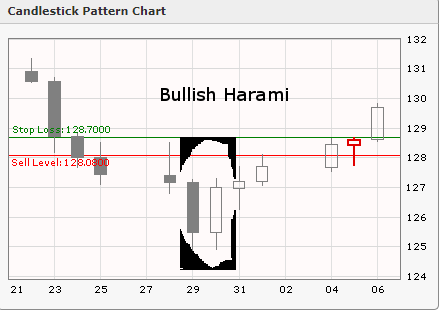
Nope my buy order is the result of a Bullish Harami on 5/30/18, however, due to the vagaries of brokers, you could be looking at the same or similar trade. 05/30/2018 BULLISH HARAMI Buy Level 126.9900 Stop Loss 124.5800 Execution at 127.258 image ...
Jay's Candle Sticker System
- JayDavis replied Jun 7, 2018
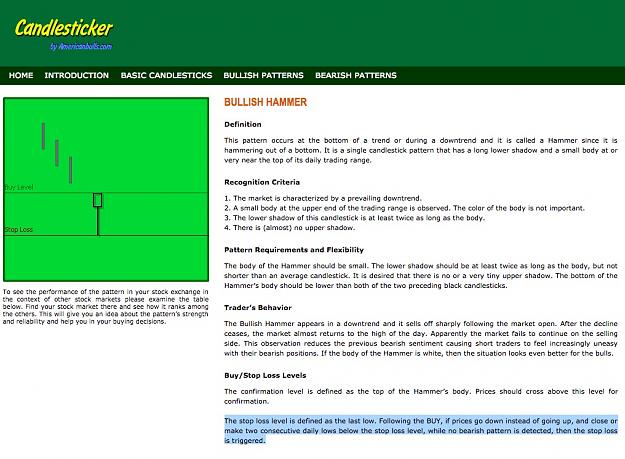
I don't use any other indicators. I don't place any stop losses on my trades with the broker. However, I do still use stop losses. When trading a candlestick formation a stop loss is naturally generated. Check out candlesticker.com I note it and if ...
Jay's Candle Sticker System
- JayDavis replied Jun 7, 2018
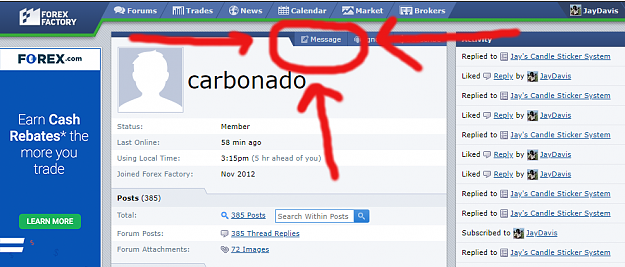
image LOL, its like you can't type twitter. Yes, @512Jay is my twitter. I can't message myself so here is a test subject.
Jay's Candle Sticker System
- Posts by Member Search: 'JayDavis'