- Search Energy EXCH
- 18 Results
-
 Jason W replied May 20, 2018
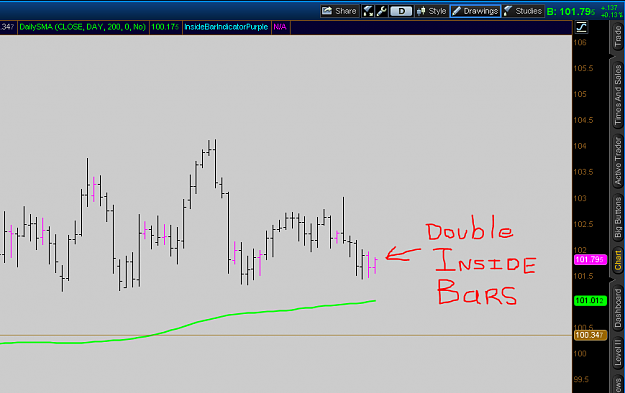
Keeping things simple and not reading too much into PC's posts is good advice however Peter himself stated point blank with no ambiguity that there were certain inside bars that had an edge over others. But he didn't reveal which inside bars he was ...
The DIBS Method... No Free Lunch continues
- Jason W replied Aug 19, 2017
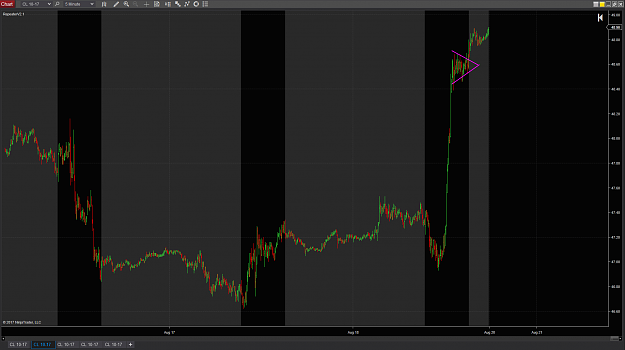
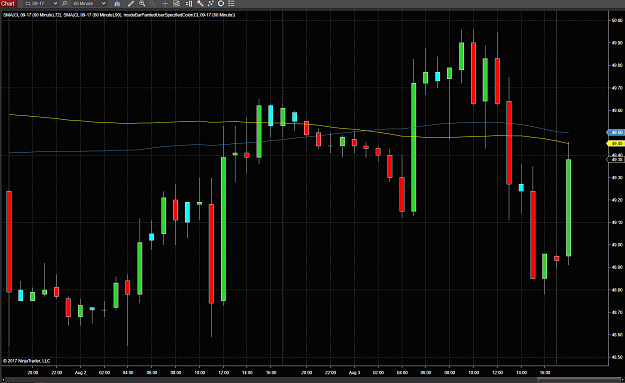
Today rallied hard into the close, moving up through the prior weekly low, and forming a very clear intraday bull flag. image This bullish momentum should carry over into early next week...
1% per day in Crude Oil
- Jason W replied Aug 5, 2017
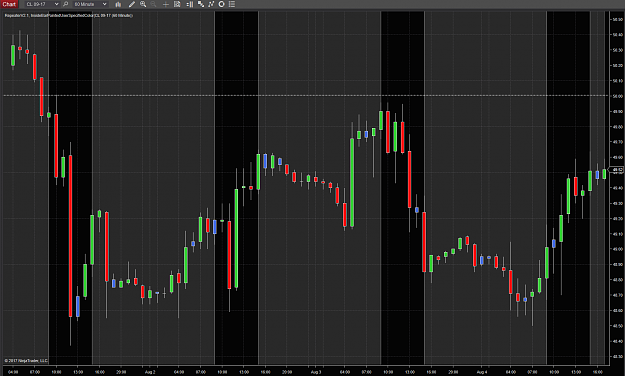
That indicator was made by a Ninjatrader staff member....so I doubt he would be too interested in making one for MT4. lol And speaking of indicators....here is another one also from Ninjatrader.....it's called the repeater....and can be used to ...
The DIBS Method... No Free Lunch continues
- Jason W replied Aug 3, 2017
The good folks at Ninjatrader forums just coded a sweet inside bar indicator for use with NT8. image
The DIBS Method... No Free Lunch continues
- Jason W replied Jul 15, 2017
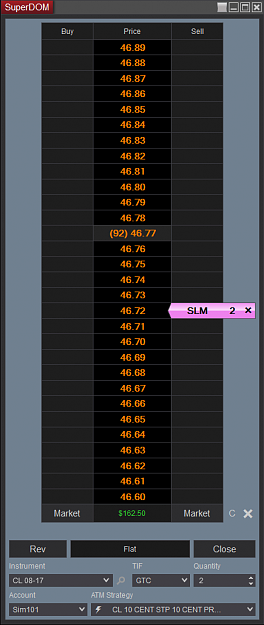
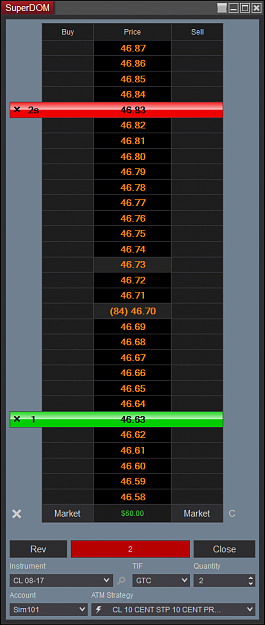
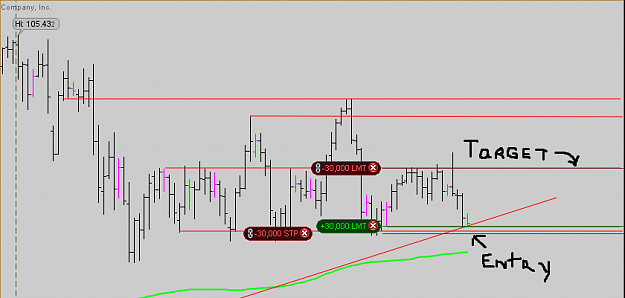
Here are what my DIBS trades look like using the static superdom. First, I enter using a 1 click stop-limit with one tick of slippage to ensure I get filled. image Once my SL fills, then an OCO order is activated, with a profit target of 1 and ...
The DIBS Method... No Free Lunch continues
- Jason W replied Jul 3, 2017
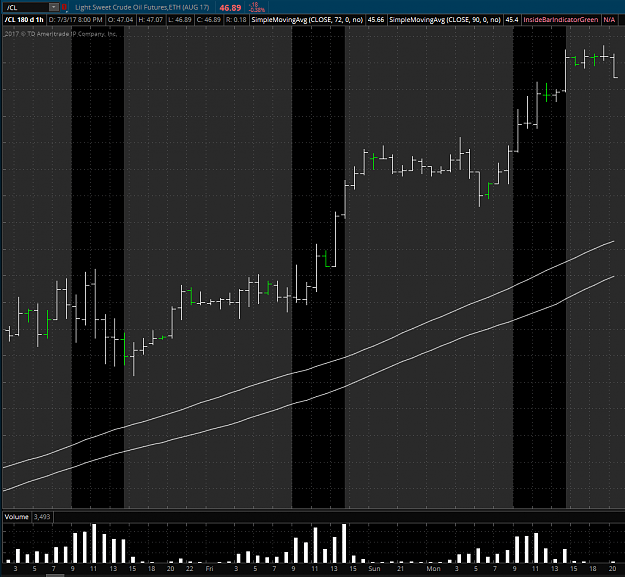
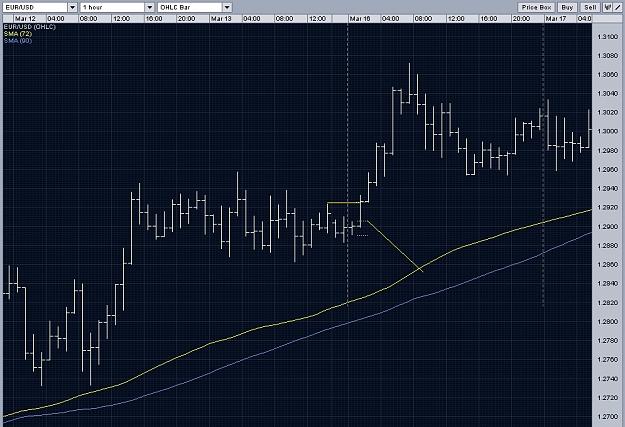
I've got an indicator as well, but it's for thinkorswim. PM me if you want the code. image PS - I've been reading a book by Toby Crabel called Trading With Short-Term Price Patterns. Peter definitely got some of his ideas for DIBS from here, no ...
The DIBS Method... No Free Lunch continues
- Jason W replied Jun 29, 2017
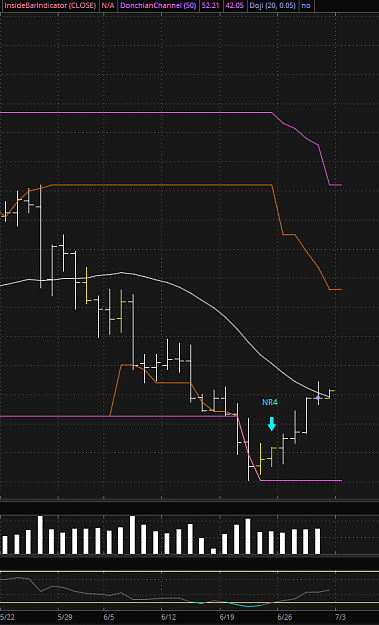
Note the appearance of an ID/NR4 pattern (inside day, and four day narrowing range as defined by Toby Crabel) that reversed the downtrend. image
Trading Crude Oil with price action + indicator
- Jason W replied Sep 28, 2016
It's looks like the bottom and middle lines are the high and low of the inside bar. The third one at the top....could that be the high from a 4 or 8 hr inside bar?
The DIBS Method... No Free Lunch continues
- Jason W replied Sep 27, 2016
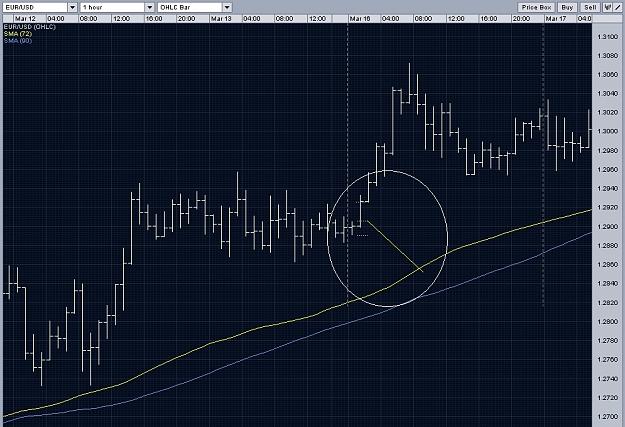
Anybody know what this is on Peter's chart? I put a white circle around it. Three dotted lines with a yellow anchor connecting to the moving averages.
The DIBS Method... No Free Lunch continues
- Jason W replied May 12, 2014
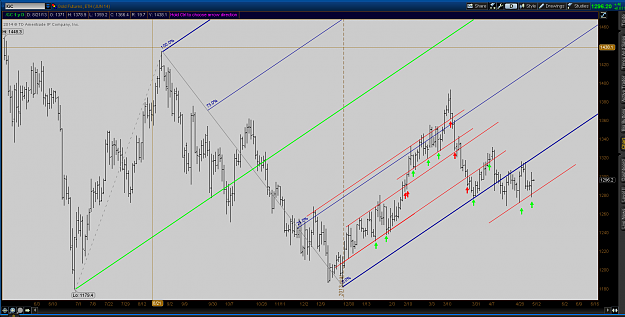
Here is chart of Gold with red sliding parallel lines: image
Andrews Pitchfork (Median Line)
- Jason W replied May 11, 2014
Going short here is not a good idea, usd/jpy has made a little w bottom. image
USD/JPY Discussion

- Jason W replied May 9, 2014
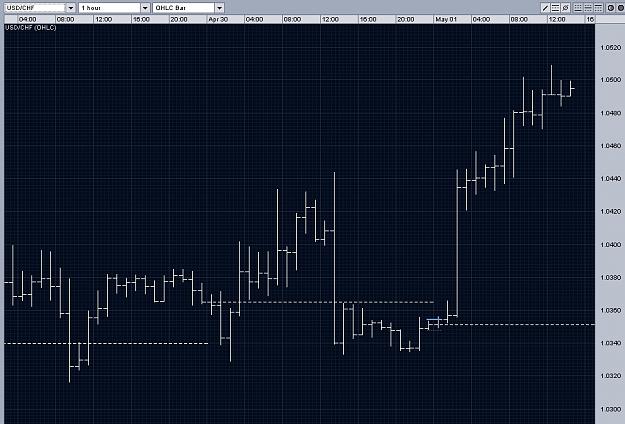
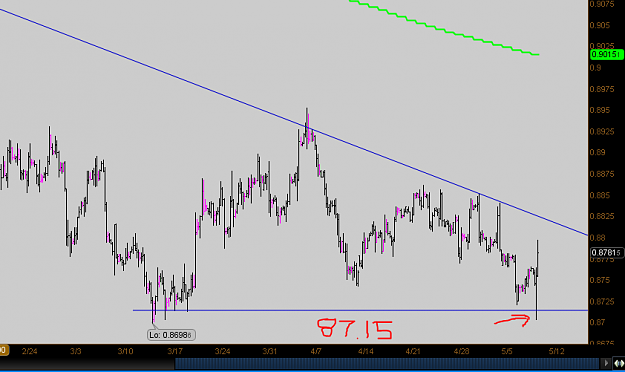
Finished the week with +70 pips. Now, looking forward, it appears a breakout is setting up, but which way? Probably up since we've got great support at 101.50, but I'll be ready in the event it goes south. image And as an aside, I think I will ...
USD/JPY Discussion
- Jason W replied May 8, 2014
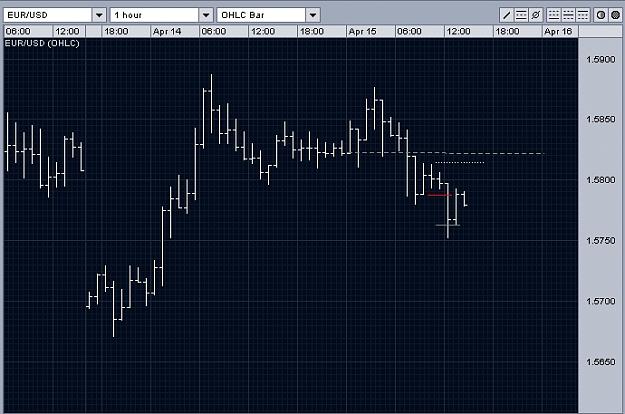
Just bought back in at 101.50 off a bounce off the trendline. image
USD/JPY Discussion

- Jason W replied May 7, 2014
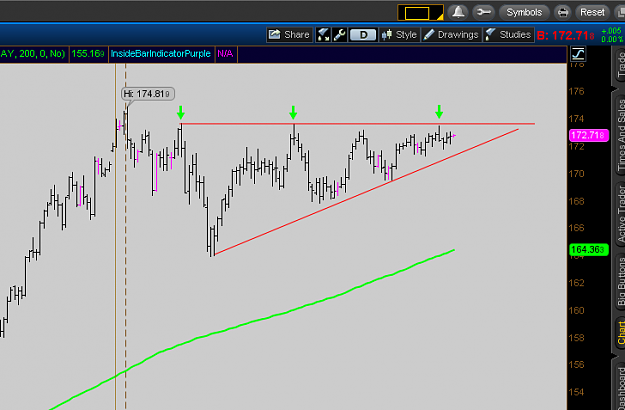
image Classic ascending triangle. Will look to buy on either a pullback to the bottom line of the wedge, or buy a retest of the breakout (presuming we do breakout to the upside).
Geppy's Geppy Thread (GBP/JPY)
- Jason W replied May 7, 2014
I like your trade. Am looking to open a similar long right now at 101.50 with a stop at 101.35 and a profit target of 102.69. image
USD/JPY Discussion
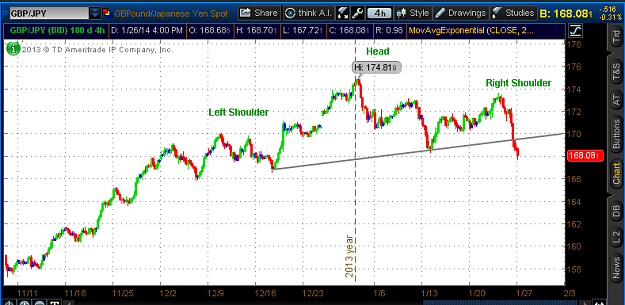
- Jason W replied Jan 26, 2014
Head and shoulders has formed on the Beast: image
Geppy's Geppy Thread (GBP/JPY)
- Jason W replied Jan 23, 2014
image Using all of these together provides some great intraday support and resistance and potential price targets.
Frankfort Breakout EA

- Posts by Member Search: 'Jason W'