- Search Energy EXCH
- 141 Results
-
 Isvara replied Mar 25, 2023
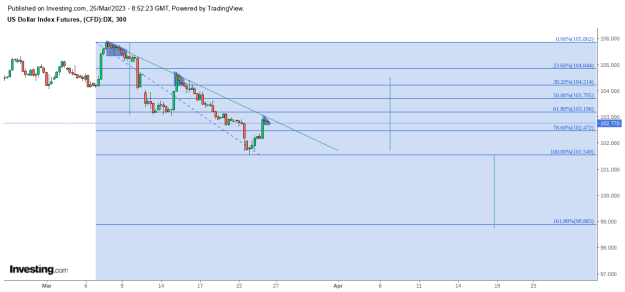
3 times in month of march. Don't think this will stop. Last week of month and quarter. Scalping is best tool to poke this market. Right now to be honest i don't see any reason why it does not hit 99 in April end or may 1st week. Then bull may enter. ...
The Swamp
- Isvara replied Jun 23, 2022
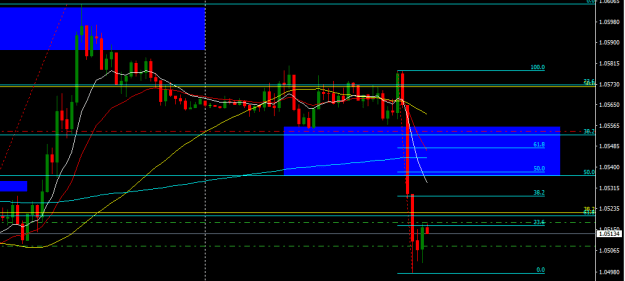
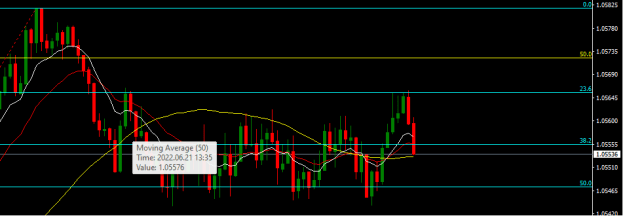
well the 50% of both moves are almost at same place. Coincidence?? I think that's an opportunity today. image
The Swamp
- Isvara replied Jun 23, 2022
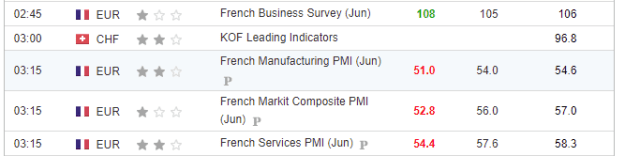
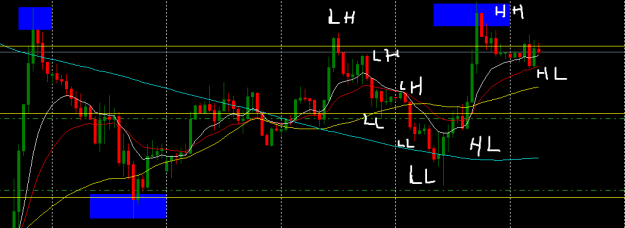
made a LL breaking yesterdays HL. now i am waiting for an bounce to make it LH and i will enter in sell. it just ate sl of every bull what a drop, was not expecting this. image see this comedy gold though. Bro what business are you surveying? ...
The Swamp
- Isvara replied Jun 23, 2022
had a sell position from yesterday and i closed it manually what a moron. image
The Swamp

- Isvara replied Jun 22, 2022
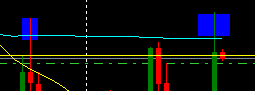
i am interested in this blue box. if it shows signs of bullishness here then maybe there is a chance otherwise my end of the month bear biased will over take every opinion. today $ went down but nothing went up significantly against it this is also ...
The Swamp
- Isvara replied Jun 22, 2022
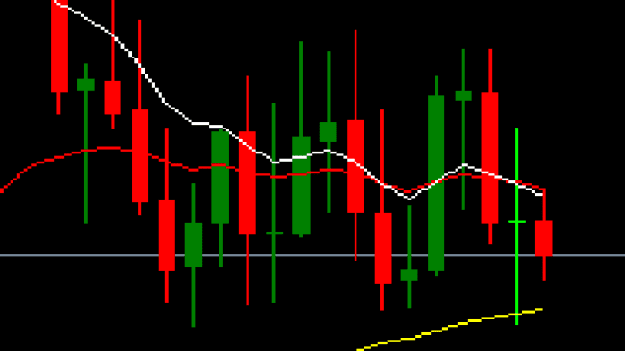
this has became bullish now. broke yesterdays swing low and today's swing lows. now can test yesterday's highs. if it breaches it flies to 0645 area, if it slows or starts consolidating and break down then its a bear continuation on HT. image
The Swamp
- Isvara replied Jun 21, 2022
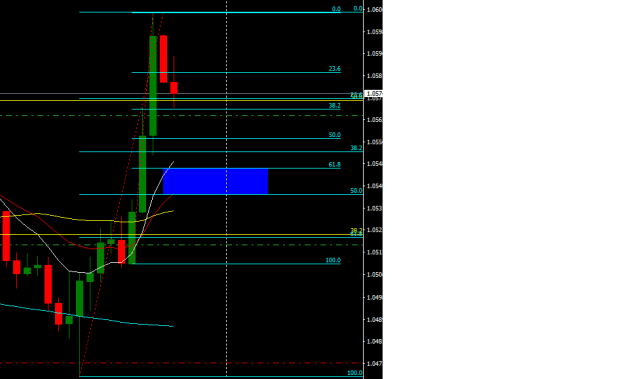
After that impulsive move up it's just literally stuck between 2 fib points. this is not a sign of bull but its a PRETEND bull in a bear setup scenario. i want it to go up for a good sell position but all i see is 0595 - 0600 max with this kind of ...
The Swamp
- Isvara replied Jun 21, 2022
just noise and no decisions. it needs to break 1 side. image i don't deal in fundamentals that much but to me it's just preparing for next 2 days of Mr. Powell.
The Swamp
- Isvara replied Jun 17, 2022
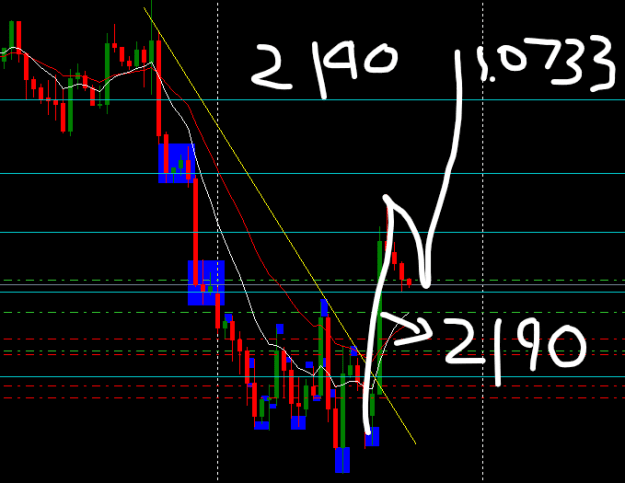
i have hedged my position at 0526. if it breaks daily open i will buy it. if it breaks 61.8 (0515) which is acting as an supp right now i will sell it. if my pip count is correct we got 2190 move yesterday so my buy tp is 0733. My sell tp is 0434. I ...
The Swamp
- Isvara replied Jun 16, 2022
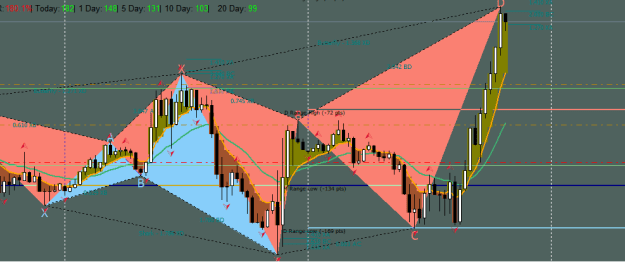
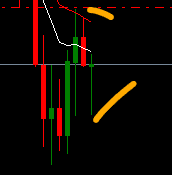
on 15 and 30 min my auto draw tool is showing pattern completion. image
The Swamp
- Isvara replied Jun 16, 2022
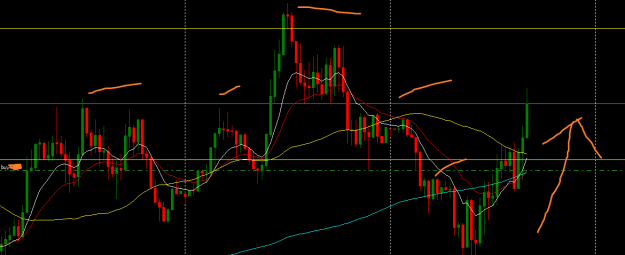
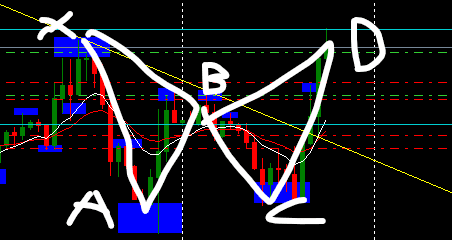
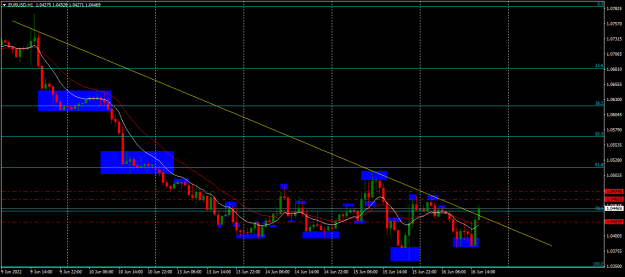
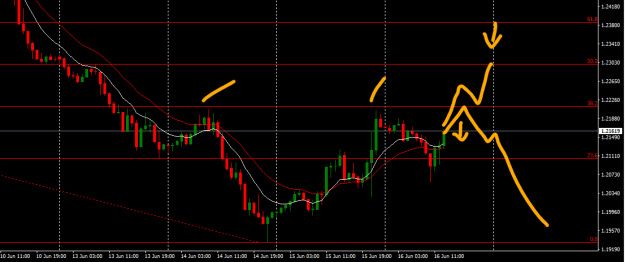
my count of ABC (ORANGE) is complete. PINK can be extended C. image For butterfly lovers that is also made acc. to my count. image At the end of both patterns trend should again continue in its path, in our case its downtrend.
The Swamp
- Isvara replied Jun 16, 2022
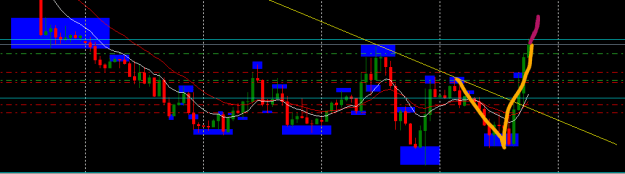
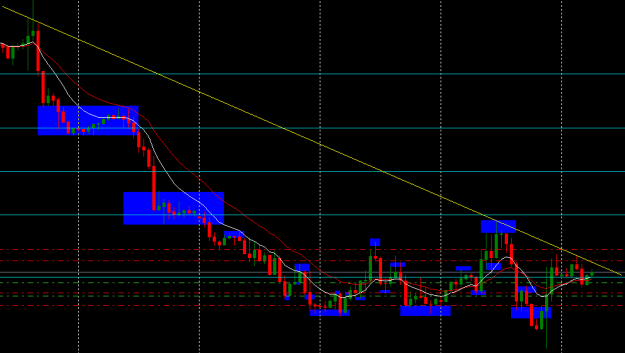
i manually closed at 0444. will enter again above. i entered again at 0464 TP at 0434. this yellow line which i drew as a joke trendline is providing bounce now.
The Swamp image
image

- Isvara replied Jun 16, 2022
4 hr close 0427. my 0500 bounce chance has increased now. let's see how the yellow line reacts when price will come back to it. also there are 2 soft R in the path of 0500. ABC pattern will be fulfilled at 50%. if it starts breaking low from there ...
The Swamp
- Isvara replied Jun 16, 2022
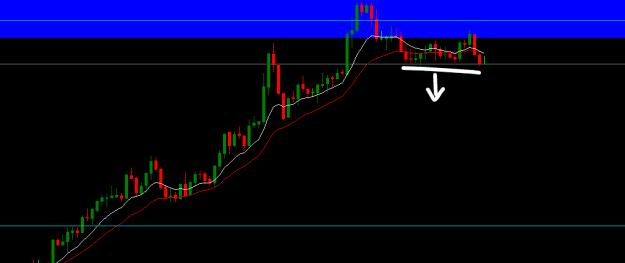
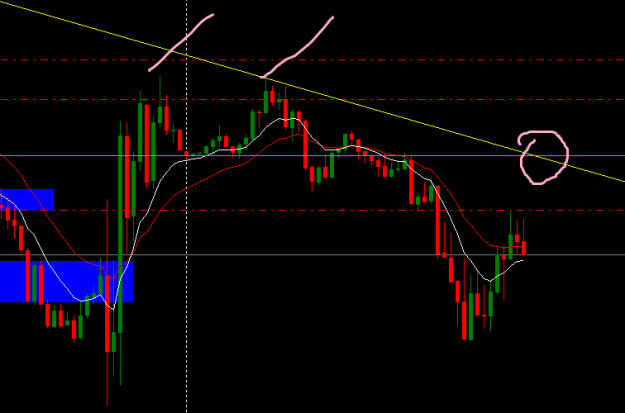
gbp is looking far more easy right now to trade. it has everything double top, 50, 61.8 to retrace. if it breaks 61.8 with a bullish pattern it will fly though but chances are less likely for that. image something is up with euro. Are they trying ...
The Swamp
- Isvara replied Jun 16, 2022
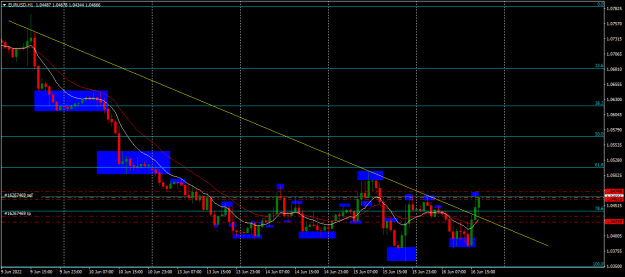
on 15 mins this a double top for me. i will wait it to reach the circled (0442) area and i will short it there. hope fully it will bounce till there in next hour. Continuation of downtrend is more likely now. 0500 bounce is not in the cards at least ...
The Swamp
- Isvara replied Jun 15, 2022
Well this yellow line is sure putting up some work. But if broken though we are open for some ABC pattern identification to both sides until then its heavily bear biased.
The Swamp
- Isvara replied Jun 15, 2022
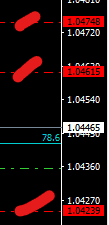
these numbers have created a soft supp and res zone in the chart.
The Swamp