- Search Energy EXCH
- 4 Results
- HonkyCat replied Sep 15, 2020
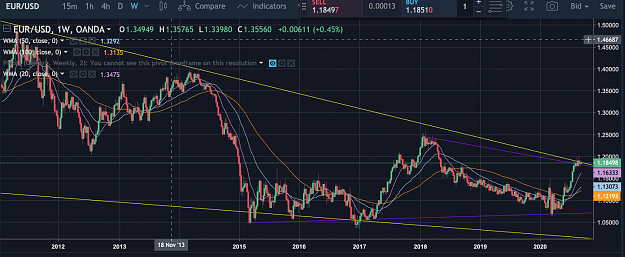
The long term picture shows that the current price is up against the top line of a couple of long time-frame channels. In the weekly chart below, the yellow line started at the high in July 2008 (currently at about 1.1864), and the purple one in ...
EURUSD only
- HonkyCat replied Feb 20, 2020
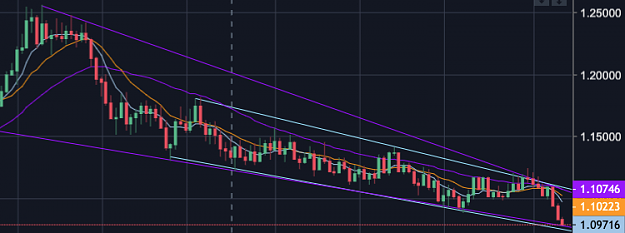
The move down today touched the bottom of the long-term trend channel (started Jan-2018) and retraced slightly upward. EURUSD weekly trend channel marked from 18-Jan-2018 to current (purple lines): image I expect the PMI reports later to either ...
EURUSD only
- HonkyCat replied Dec 12, 2019
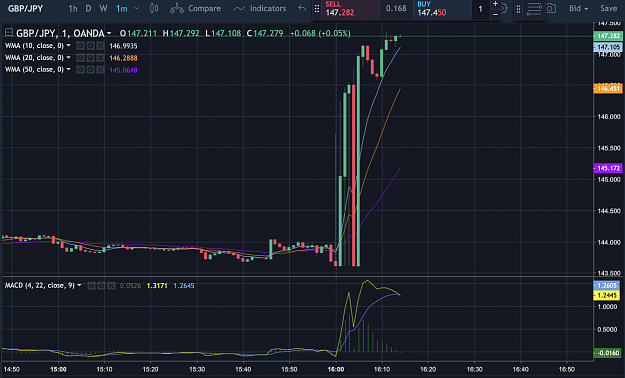
I don't understand how a stronger likelihood of a clean Brexit is bullish for the Euro. As an aside, and a little OT for this thread, it was fun making 300 pips on a speculative single micro-lot of GBP/JPY as the news broke, and watching the price ...
EURUSD only
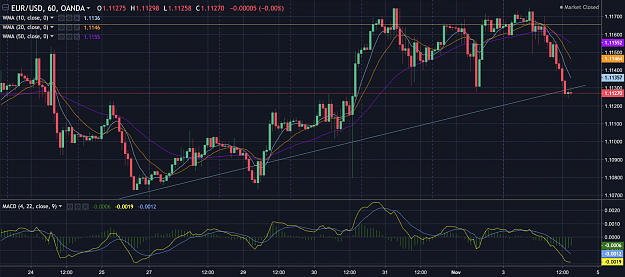
- HonkyCat replied Nov 4, 2019
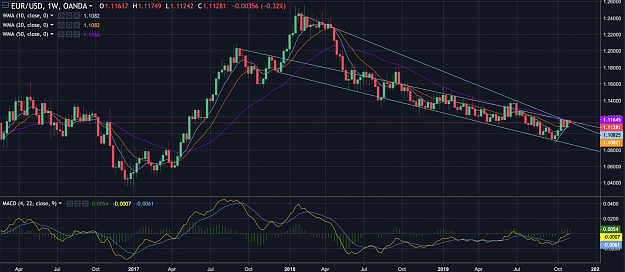
Weekly trend shows 1.0870 - 1.1150 trading range, declining, with 50W MA @ 1.1165 and both 10W & 20W MA at 1.1082. Hourly chart shows most recent uptrend bottom @ 1.1129, can also be seen on the weekly chart as the steep blue uptrend line. I'd ...
EURUSD only
- Posts by Member Search: 'HonkyCat'