- Search Energy EXCH
- 32 Results
-
 GregT replied Jan 19, 2017
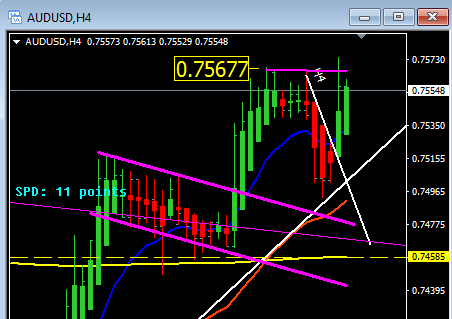
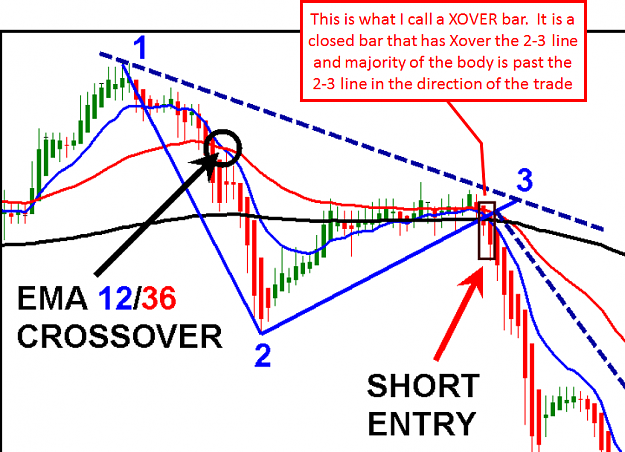
Filipo - do you enter as the Xover bar is taken out for M5 setup or on this occasion will you prefer to wait until the near term R-Level at 0.7567 gets taken out? image
The Spartan Trader FX System
- GregT replied Jan 19, 2017
I see a conflict with D1 bias which could be going long i.e. the current bar is the Xover bar at point 3, so I am waiting to see where H4 goes in next few bars and probably wait till I see D1 bar close tomorrow before I act on this trade. To paste a ...
The Spartan Trader FX System
- GregT replied Jan 16, 2017
image My interpretation of the Spartan strategy is that we should wait for the Xover bar to close then enter as follows: if Xover bar is D1, wait till D1 close + 5 pips is taken out in the direction of intended trade if Xover is H4 or below, then ...
The Spartan Trader FX System
- GregT replied Jan 3, 2017
My Spartan123 Watch List for 2016-01-04: EURUSD short - waiting for momentum to show on LTF first EURCAD short - waiting for momentum to show on LTF first EURAUD short - waiting for S123 setup on H4 to reach point 3 GBPCHF short - waiting for a H1 ...
The Spartan Trader FX System
- GregT replied Dec 22, 2016
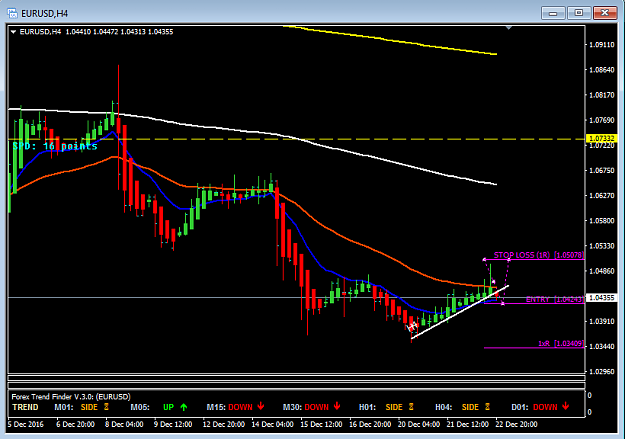
I see a new setup for today in EURUSD Price has been rejected by sellers at touch of D1 12eMA forming a reversal bar, coinciding with a 123 setup on H4 36 eMA image
The Spartan Trader FX System
- GregT replied Dec 21, 2016
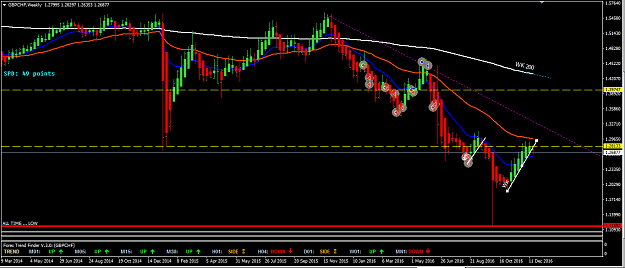
Upcoming GBPCHF short trade is setting up on WK TF - Point 3 Xover bar is forming this week - possible entry next week - reversal is coinciding with re touch of an R level @ 1.2813 - wait for WK bar to close and plan entry next week perhaps image ...
The Spartan Trader FX System
- GregT replied Dec 21, 2016
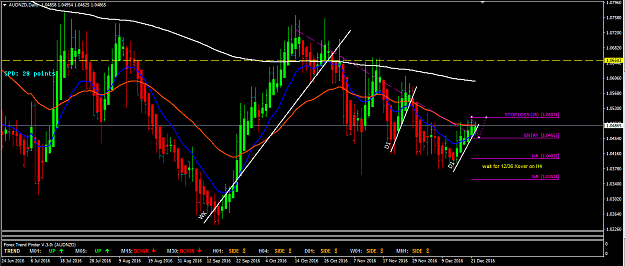
I am seeing AUDNZD currently at point 3 and setup for a spartan short trade. - LL are being made - Higher Time Frame (HTF) MAs are above price forming more resistance But I am waiting for H4 12eMA to Xover H4 36eMA before I enter. If you agree then ...
The Spartan Trader FX System
- GregT replied Nov 21, 2016
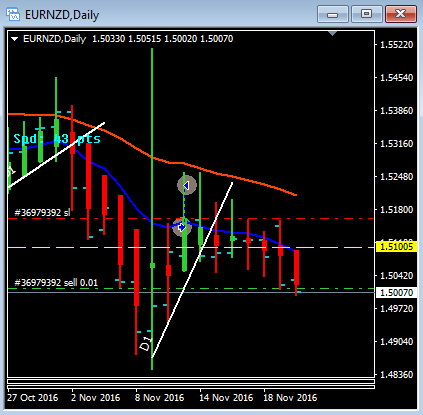
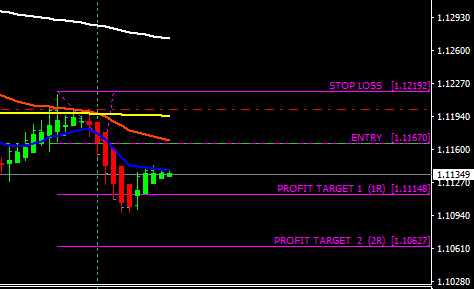
New Trade - EURNZD Short Reasons: D1 Xover bar formed yesterday after 3 days of no volatility after Point3 formed on the 15th. News is touting Kiwi to weaken further. Price is diverging away from all HTF MAs, which are themselves diverging nicely ...
The Spartan Trader FX System
- GregT replied Nov 21, 2016
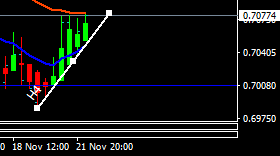
I think NU is still setting up - here is a H4 screenshot from my charts image
The Spartan Trader FX System
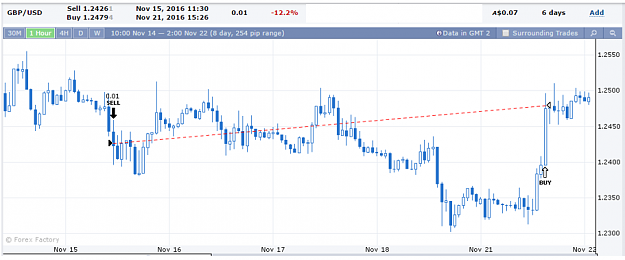
- GregT replied Nov 21, 2016
My GU trade failed last night during the NY session while I was sleeping. I had moved the SL during the day to inside the wicks of the previous H4 swing point in an effort to start reducing my risk and get into profit eventually. I was at 15+% ...
The Spartan Trader FX System
- GregT replied Nov 7, 2016
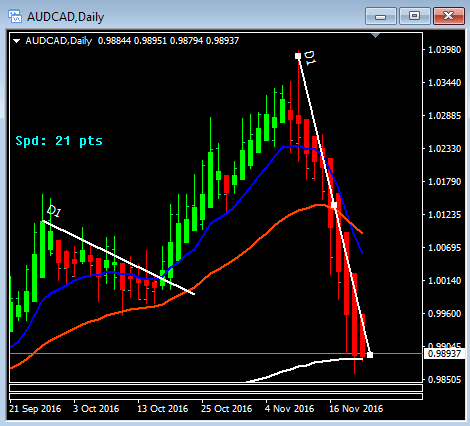
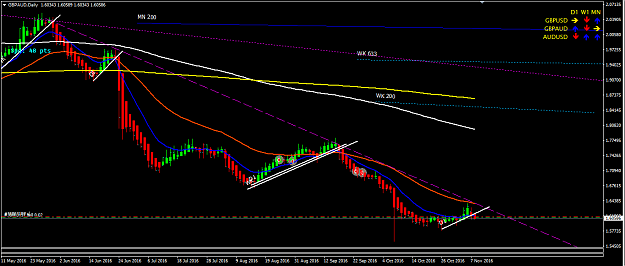
I am seeing GBPAUD going SHORT, not long like you are JAK mainly because price has not broken above the Daily Sloping Trend Line (STL) shown by my purple dashed line. My 36eMA is red (and my 12 is blue, 200 is white, 633 is yellow) image
The Spartan Trader FX System
- GregT replied Sep 6, 2016
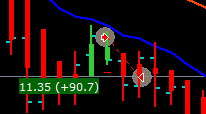
Here is a link to the DRAWPROFIT indicator that Edd1e uses to show closed trades directly on MT4 charts url Upload it as a new indi into whatever data folder you have active for MT4, then Just drag it onto each chart like we do for other indi's, ...
The Spartan Trader FX System
- GregT replied Jun 19, 2016
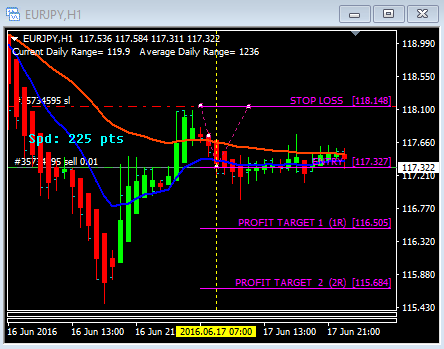
I am doubtful that the Spartan strategy will be reliable this week given the potential for volatility from the Brexit vote. I have exited all the trades I had last week that showed no momentum (momo) and just retained a small position in EJ short ...
The Spartan Trader FX System
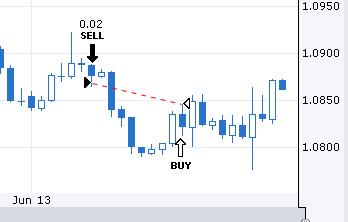
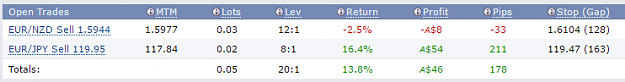
- GregT replied Jun 16, 2016
The EChf did not work out as price hit my trailing SL but I took a small profit - see attached screenshot image I am still in the EJ and EN image I use the Forex Factory Trade Explorer tool to track my trades, share what I am trading and to ...
The Spartan Trader FX System
- GregT replied May 30, 2016
Good to see someone else here looking to discuss how they trade the spartan approach. I agree that AJ H4 bias is downwards, so I would only be looking for a short trade setup, which is not currently in place. Good outcome for you to get the profit. ...
The Spartan Trader FX System
- GregT replied Oct 19, 2014
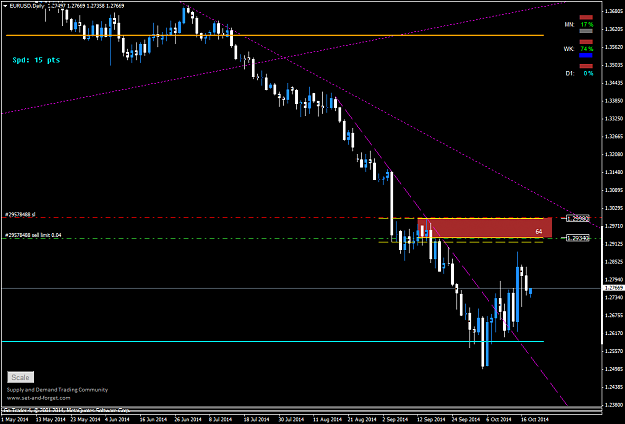
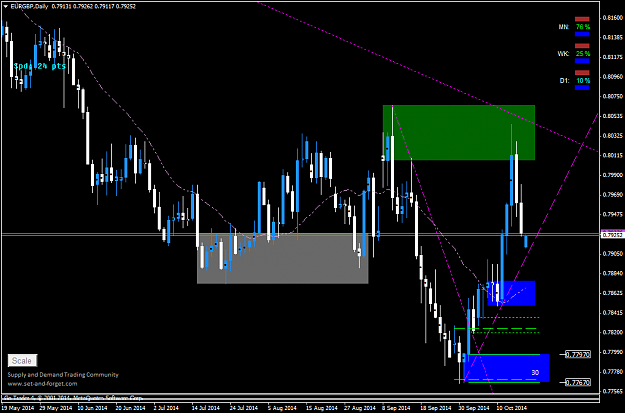
Hi Fex, My thoughts are: I agree with you that MN and WK bias currently appears SHORT. However, I see the D1 situation as follows: Price action since mid-Sept has taken out previous opposing DZ's from 2013-07-09, which validates the SZ shown in the ...
Supply and demand in a nutshell by Alfonso Moreno
- GregT replied Oct 19, 2014
I am also looking at a LONG D1 TF entry from 7797 if price retraces back to that nested WK/D1 level. I am not interested in the higher D1 DZ around 7873 as that zone has not been validated by price action taking out a previous opposing SZ from 9th ...
Supply and demand in a nutshell by Alfonso Moreno
- GregT replied Jul 26, 2014
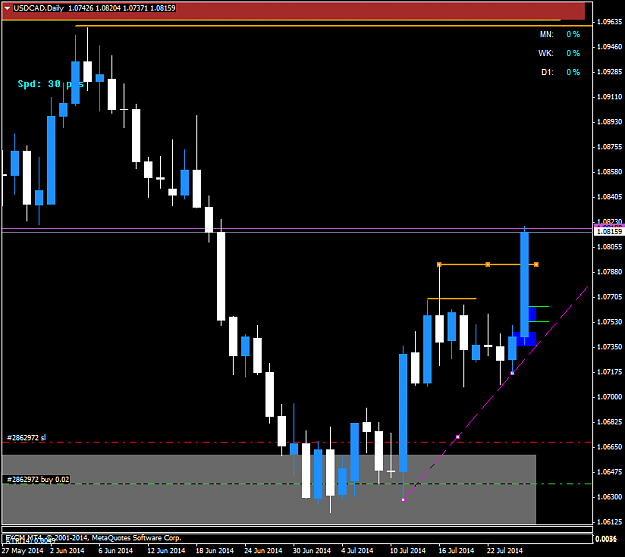
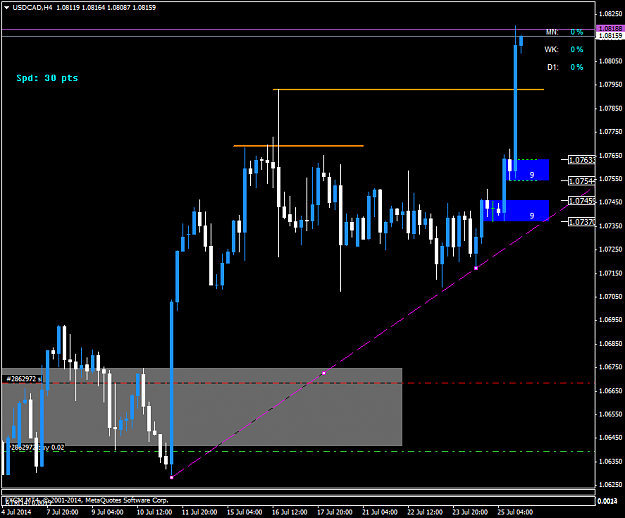
I am currently trading the USDCAD long (see my post 4470). I feel there are a few issues with your analysis as follows (I am no expert at this strategy yet so putting my thoughts into this thread will be a useful learning thing for me too): 1) I ...
Supply and demand in a nutshell by Alfonso Moreno
- GregT replied Jul 7, 2014
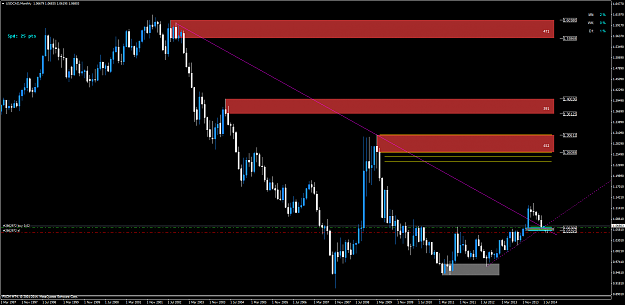
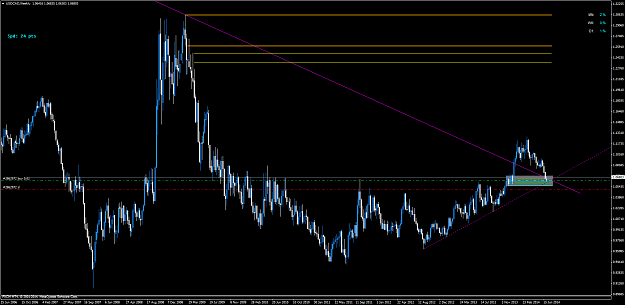
Hi Fxww42, I would be keen to track your progress with your USDCAD long trade, as I entered on 2014-07-01 on the same setup at 1.0639 (see attached Weekly & Monthly charts) This looked to me to be a great setup as price returned to a DZ that ...
Supply and demand in a nutshell by Alfonso Moreno