- Search Energy EXCH
- 17 Consecutive Red CandlesStarted May 19, 2016|Trading Discussion|0 replies

Just noticed going over historical charts, on GBPCAD 5m chart of last November, there were 17 ...
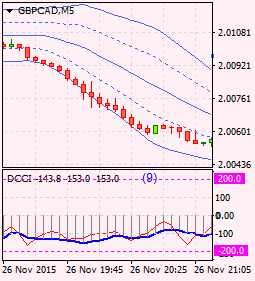
Just noticed going over historical charts, on GBPCAD 5m chart of last November, there were 17 ...