- Search Energy EXCH
- 77 Results (2 Threads , 75 Replies )
-
 FXEZ replied Apr 2, 2022
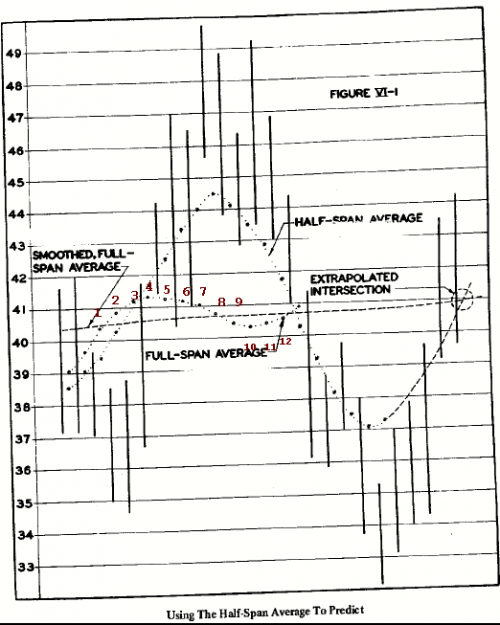
I think you're asking the right questions - questions I've asked many times myself as I've worked on this the past couple of years. It's difficult to come up with real-time workable strategy based on these concepts as described by Hurst that fill in ...
Trading Focal Points -- "A Leap Of Faith"...
- FXEZ replied Mar 22, 2022
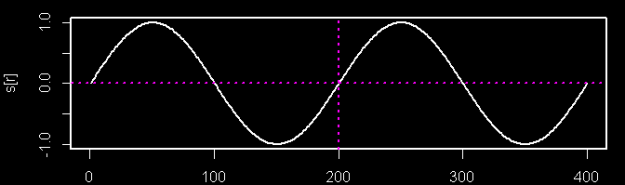
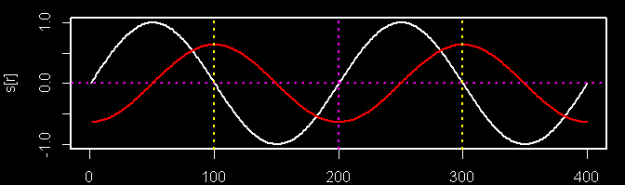
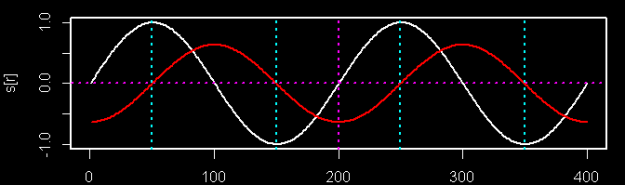
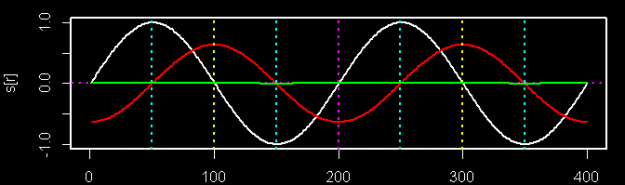
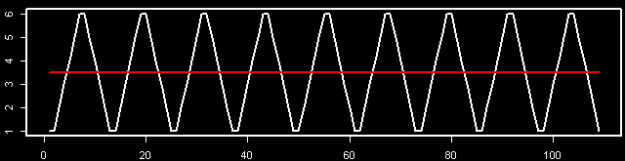
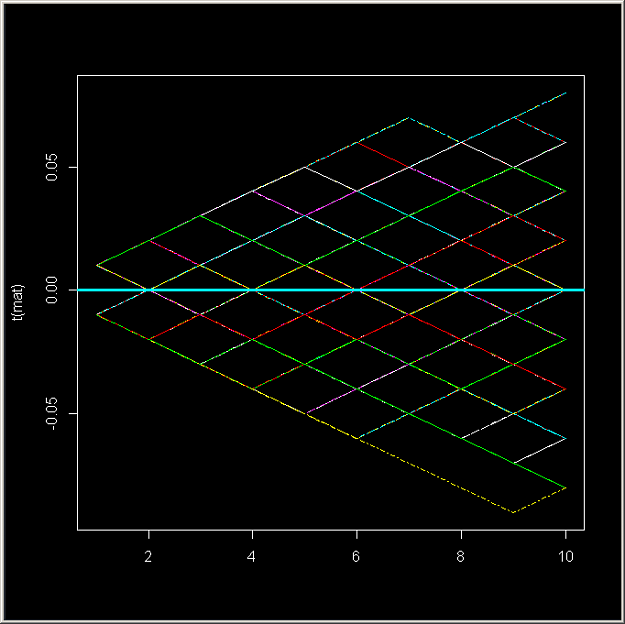
Interesting idea but this is not the reason Hurst did it this way. The reason for using multiples of 2 for moving average lengths relates to the nature of sine waves and cycles and how they interact. I'll attempt to show rather than tell so you can ...
Trading Focal Points -- "A Leap Of Faith"...
- FXEZ replied Feb 23, 2022
This is a good line of inquiry because it made me think, and I think a lot of people jumped over this in the text (like I did on first read). I read this part in the book several times and I think the answer must be inferred from other concepts ...
Analysis and Trading based on Envelopes, Waves, Cycles
- FXEZ replied Jul 27, 2020
Yes and this one too.
Analysis and Trading based on Envelopes, Waves, Cycles
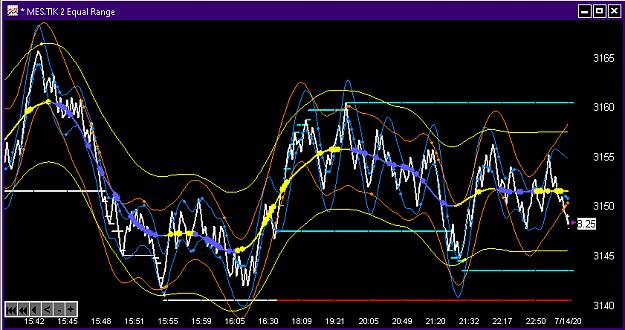
- FXEZ replied Jul 20, 2020
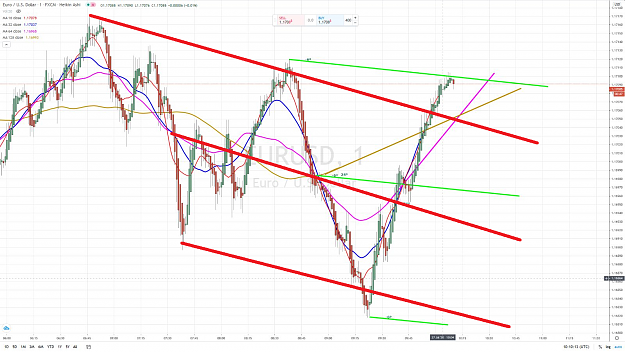
Looked like a textbook break of trendline and test off middle average in uptrend. image
Analysis and Trading based on Envelopes, Waves, Cycles
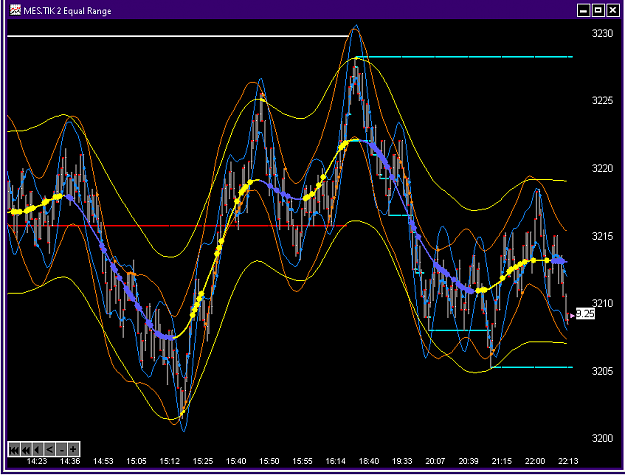
- FXEZ replied Jul 17, 2020
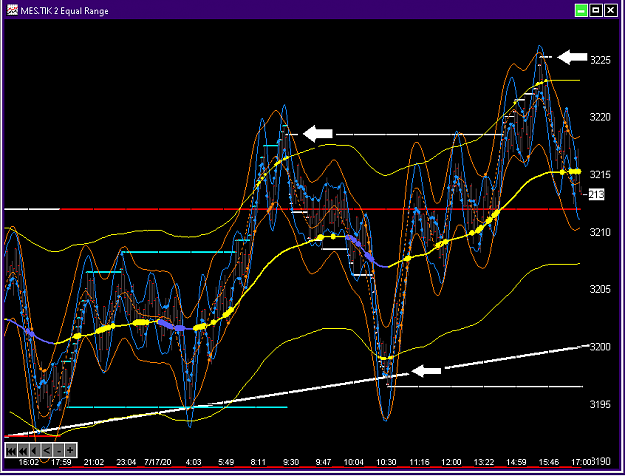
Ah thanks. I saw 3 spots on the S&P where the low/highs matched up with where the outer lines would logically be projected almost exactly (white arrows). I don't have a graphical tool to help me (yet) other than doing the calculations on my ...
Analysis and Trading based on Envelopes, Waves, Cycles
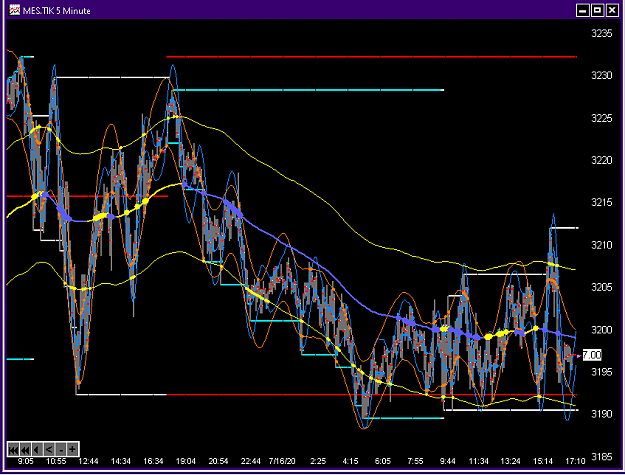
- FXEZ replied Jul 16, 2020
It's been a bit of a chop zone but lots of nice scalps off the envelopes to be had. image 5 Min: image
Analysis and Trading based on Envelopes, Waves, Cycles
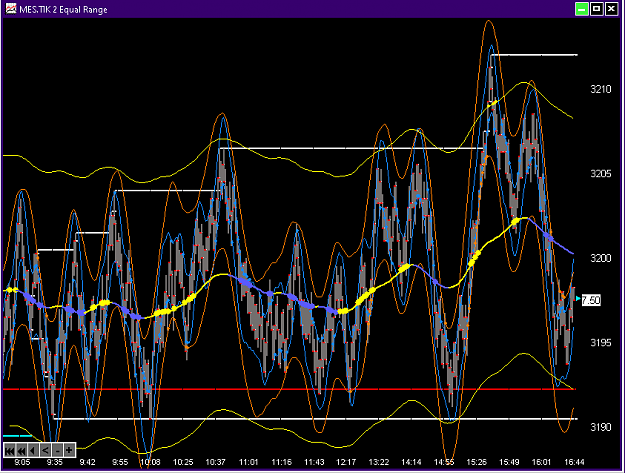
- FXEZ replied Jul 15, 2020
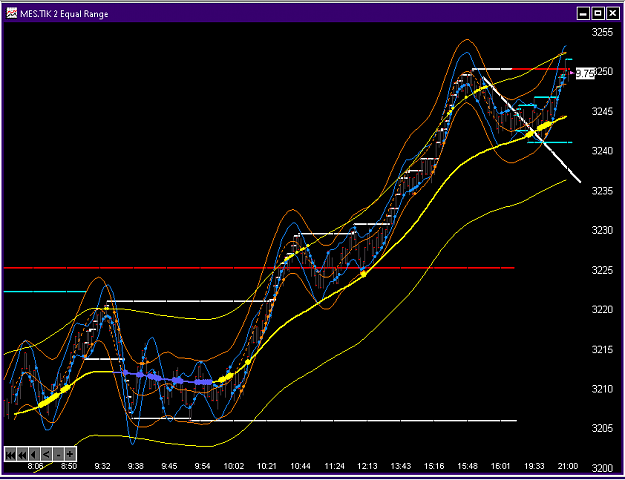
I had fun scalping the S&P 500 today with these envelopes. There are so many trading opportunities just focusing on the interplay of the orange (mid band) and the yellow (long band). image
Analysis and Trading based on Envelopes, Waves, Cycles
- FXEZ replied Jul 14, 2020
parisboy - thanks for making this thread. I really wish I had found this when I started trading, but I'm glad I have another chance to learn this material. I studied Hurst early on but was unable to make anything out of it. This time I decided to go ...
Analysis and Trading based on Envelopes, Waves, Cycles
- FXEZ replied May 14, 2020
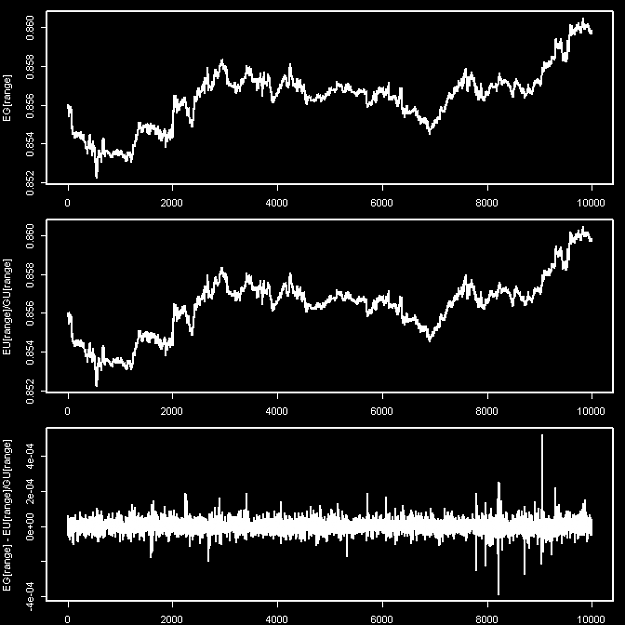
There is a triangular relationship that runs at the core of all FX because we don't trade currencies, but rather currency pairs. So E/G = E/U * U/G (note the U cancels out). So if you don't have EG quotes but do have quotes for EU and GU, you can ...
Real or Algo
- FXEZ replied Mar 31, 2020
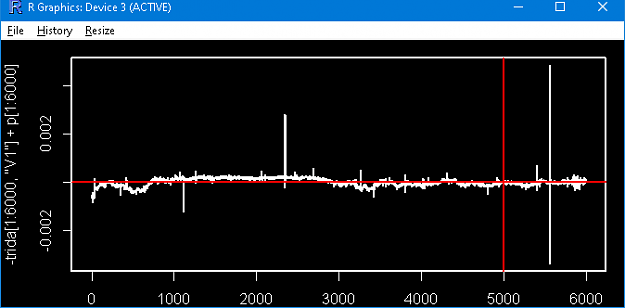
I've been away from FF for a long time. This topic was dealt with in excruciating detail way back then, and apparently still is of interest to someone today. I guess some things never change. Some in this thread have posted examples of ...
Forex is random
- FXEZ replied Sep 27, 2017
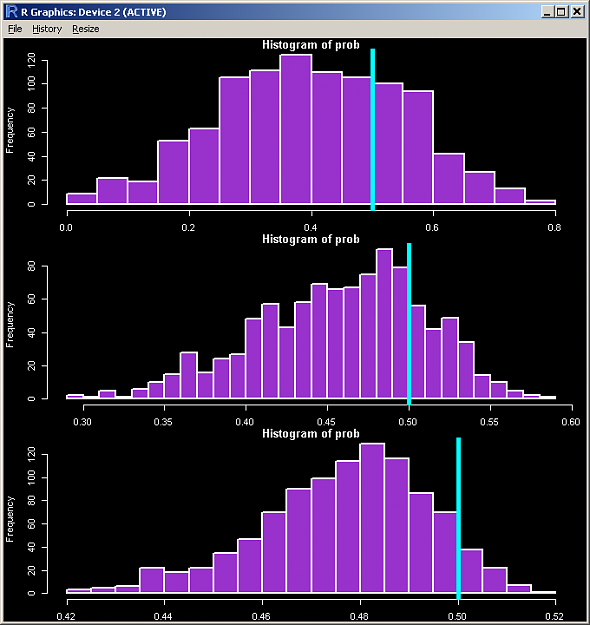
Nice job AntiCre. It is rare to see code posted to test hypotheses, and it was nice to see this code in a language that I'm conversant, R. I changed your code slightly to allow for testing different values for games and rounds (but probably not ...
Higher Edge within a Single Candlestick
- FXEZ replied Jan 16, 2017
Thanks Copernicus! Yes, ideally we would like to find something in the market that is deterministic so that we can exploit it over and over. Just like a deck of cards that is nearly all dealt and the remaining values are known to the card counter, ...
FXEZ's Quantitative Research In R
- FXEZ replied Jan 16, 2017
Yes that's a visually pleasing way to show a deterministic 1 dimensional random walk. It is deterministic because in advance you know there will be exactly 5 wins and 5 losses - you just don't know the order. So the ideal betting strategy would ...
FXEZ's Quantitative Research In R
- FXEZ replied Jan 14, 2017
Good point. Yes and after making the adjustment to only include historical results up to the last bar, I still see similar results. It's worth noting that in a real world application there will likely be more variance in the results so the ...
FXEZ's Quantitative Research In R
- FXEZ replied Jan 14, 2017
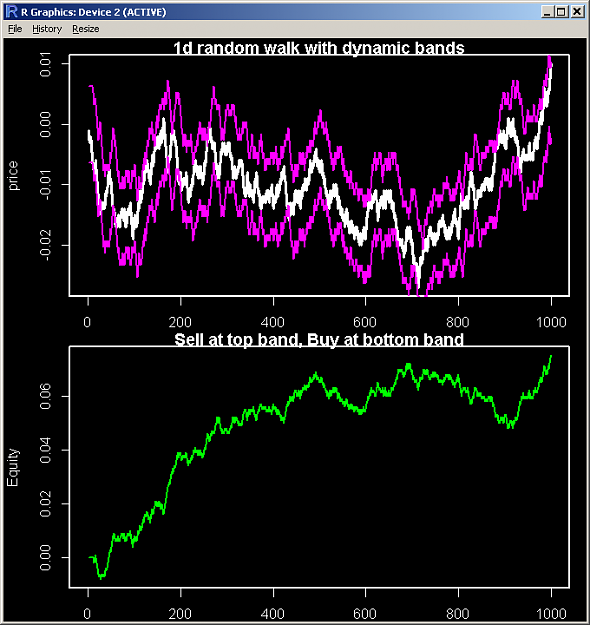
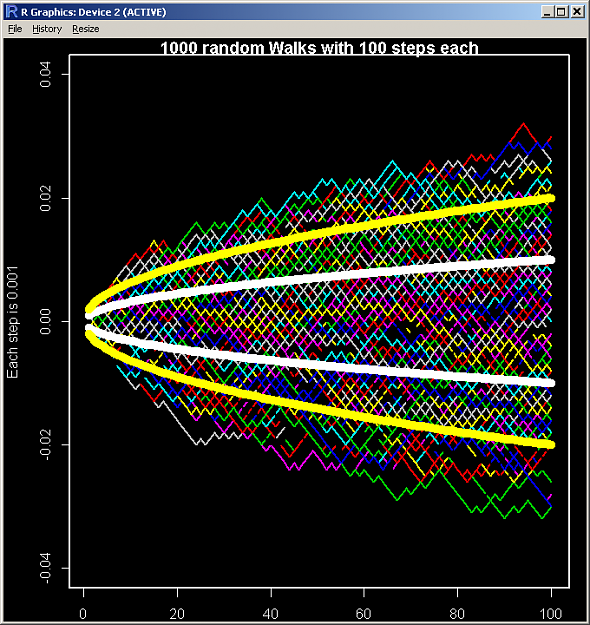
Inspired by this nifty graphic on Random Walks as well as the curves posted by alphaomega, Copernicus, PipMeUp, ezcurrency, 9047 and possibly others, I decided to roll my own one dimensional random walks. I also decided to incorporate something that ...
FXEZ's Quantitative Research In R
- FXEZ replied Jan 13, 2017
Thanks for posting this paper. It's an interesting idea - similar to altering bet size based on counting cards in blackjack. However as you point out it is dangerous. In retrospect (after you run a system test on historical data), expectancy is ...
FXEZ's Quantitative Research In R
- FXEZ replied Dec 29, 2016
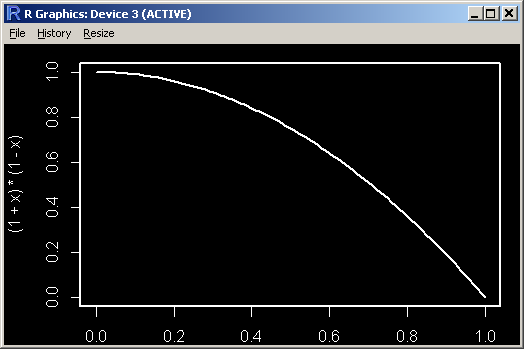
Very impressive, PipMeUp! I had a feeling your math skills would come into play in deriving a solution. A question about your starting formula: It looks like the (1+x) is simply a representation of percent gain and (1-x) would be a percent loss from ...
FXEZ's Quantitative Research In R
- FXEZ replied Dec 28, 2016
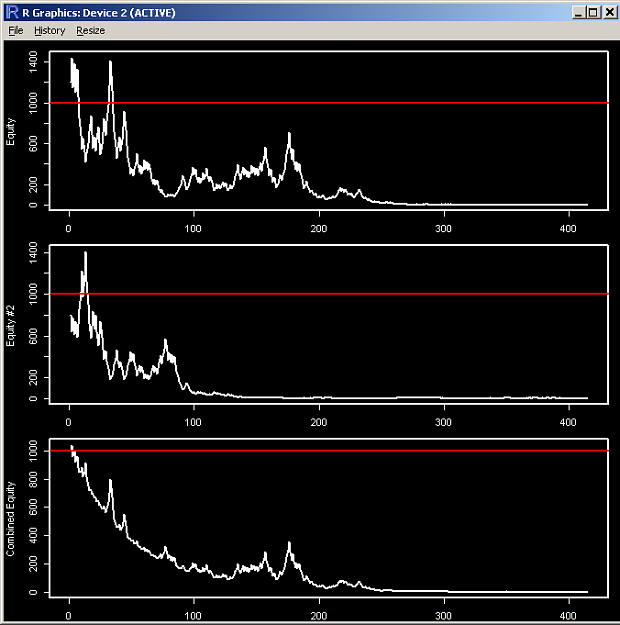
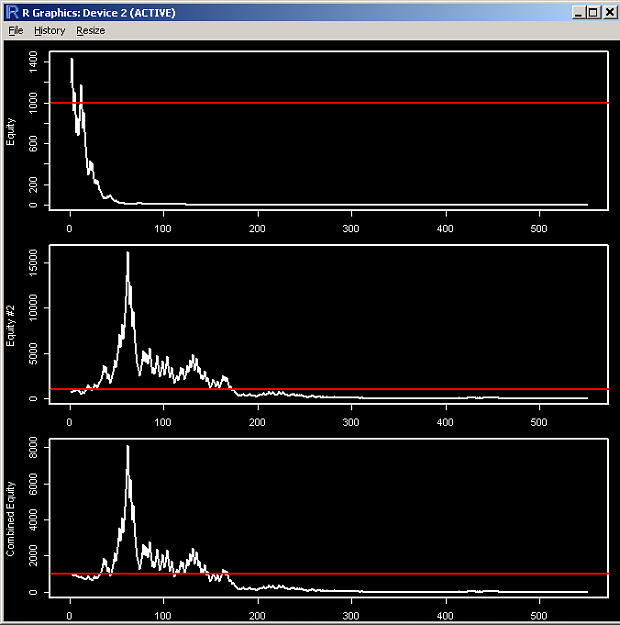
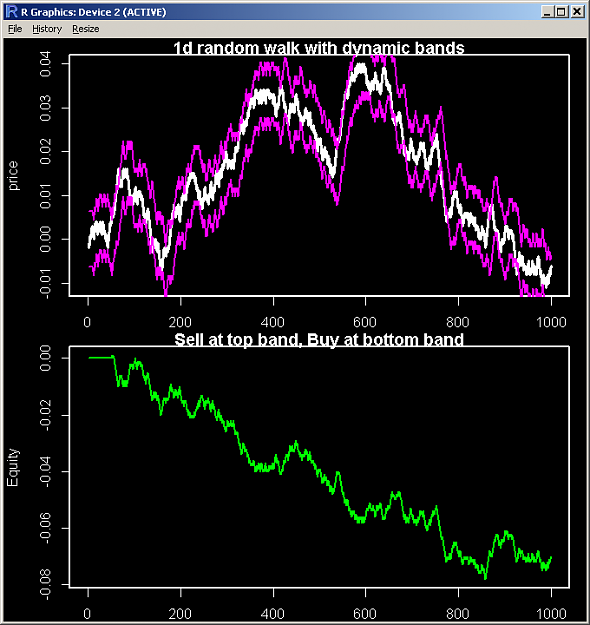
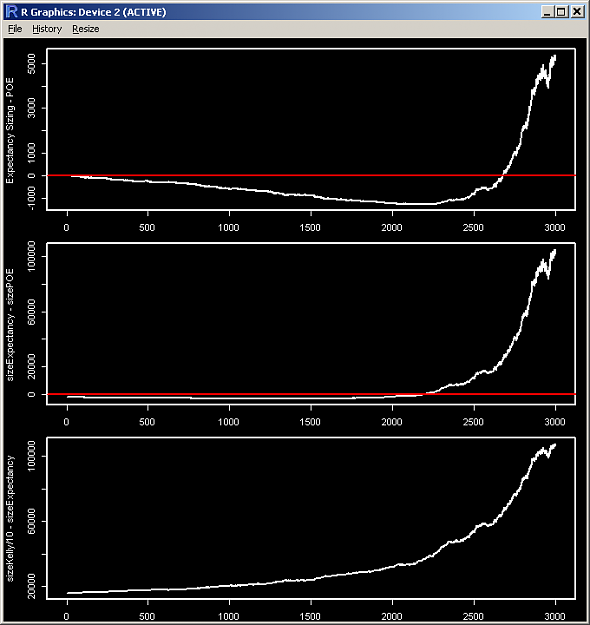
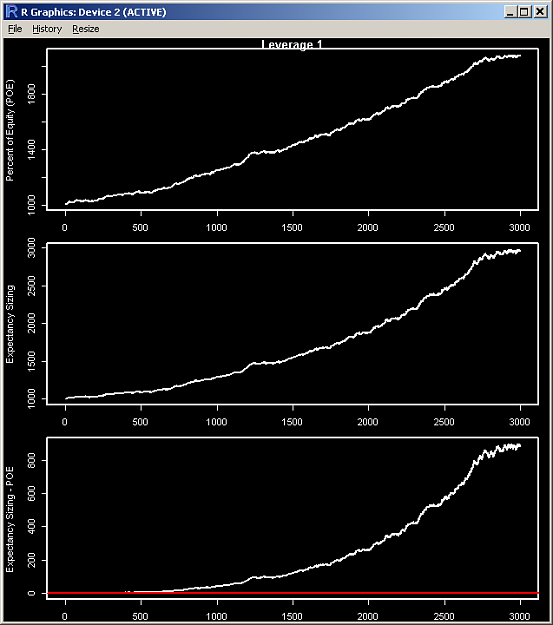
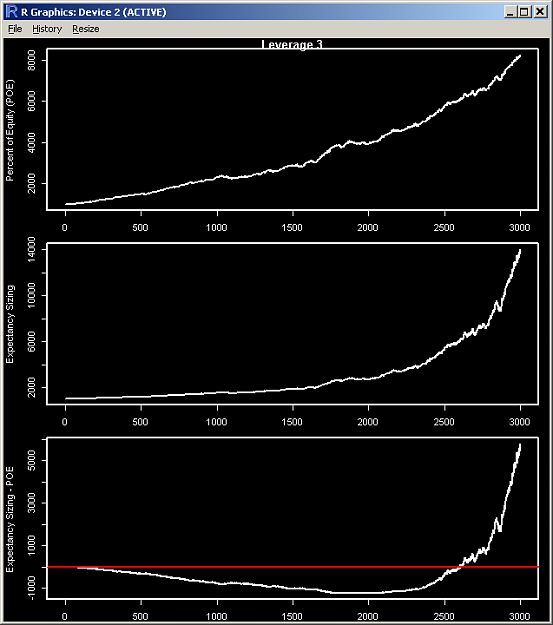
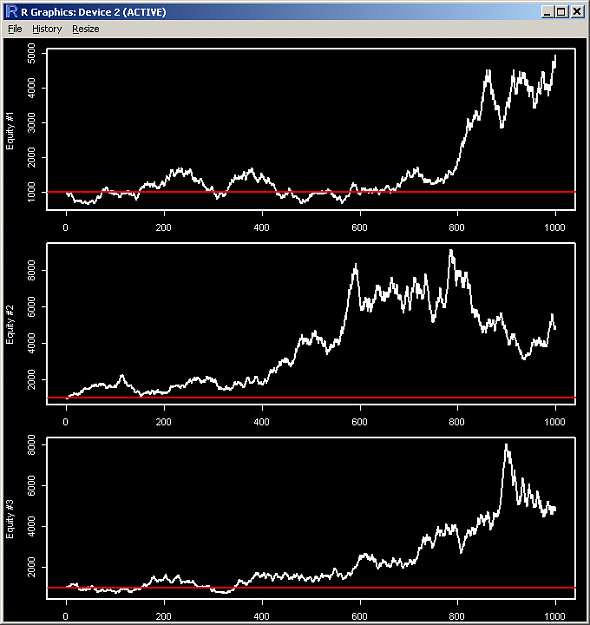
The following three charts represent three different systems. All are profitable. In your opinion, which one is the best of the three? All three systems started with the same amount of money: $1000, and used the exact same money management strategy: ...
FXEZ's Quantitative Research In R
- FXEZ replied Dec 26, 2016
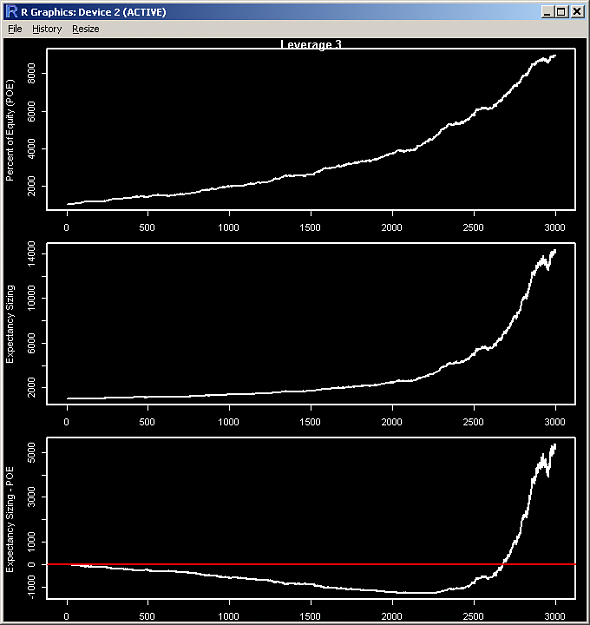
#3) POE Percent of Equity money management comparison using opposite signals, and combined equity curve: What if we took regular and opposite signals and traded two POE accounts? And what if we averaged these two POE curves into a single equity ...
FXEZ's Quantitative Research In R