- Search Energy EXCH
- 6 Results
- FXBarbarian replied Jul 30, 2018
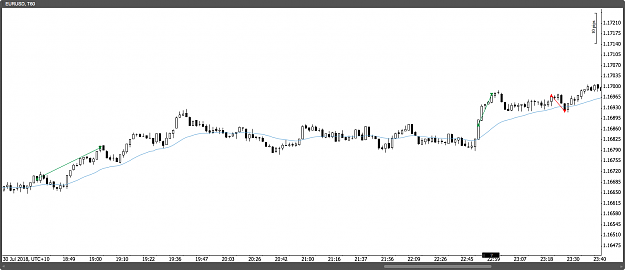
In case anyone's curious, this is what the three trades looked like in my live account, on the 60-tick chart that I'm getting through cTrader/Pepperstone. It's hard to see, but there are two green lines and one red line, each marking my trades: ...
Volman Style (70-tick chart)
- FXBarbarian replied Jul 30, 2018
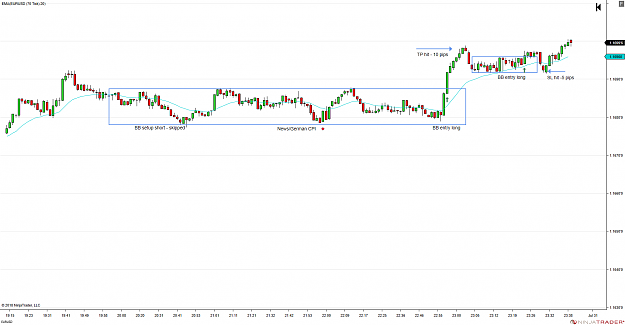
Trades 2-3: +10 pips, -5 pips My second trade at about 23:00 was another BB after a long setup, and it snagged me another +10 pips. My third trade went the other way and hit my SL for -5 pips. Looking back at this, I'm realizing that I'm mixing up ...
Volman Style (70-tick chart)
- FXBarbarian replied Jul 30, 2018
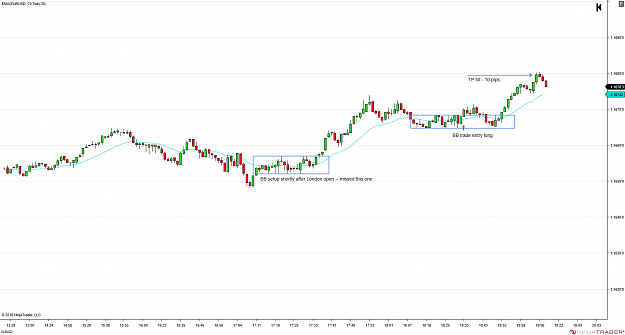
Today is my first day of pure Volman-style scalping on the EURUSD tick chart. I'm in Australia, so for me the London session starts at 17:00 (09:00 London). I usually start trading when I get home from my day job, and I wrap up around midnight. ...
Volman Style (70-tick chart)
- FXBarbarian replied Jul 30, 2018
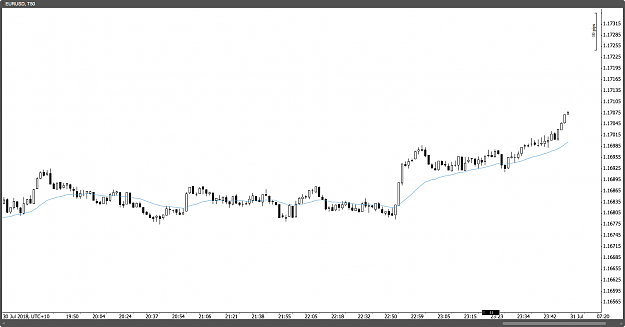
The third platform I tested was cTrader (with Pepperstone). This is a 50-tick chart. image I'm pretty happy with Pepperstone as a broker, but cTrader isn't getting the same volume of tick data as the others. The chart above covers much more time ...
Volman Style (70-tick chart)
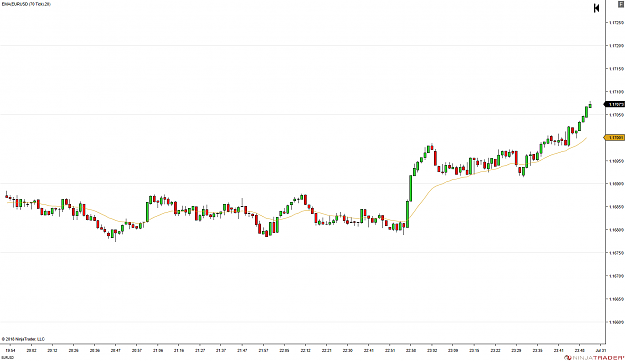
- FXBarbarian replied Jul 30, 2018
This tick chart is from NinjaTrader: image I grabbed this chart about 5 minutes before the ProRealTime chart above, but if you look at the big bull BO around 2258, you can see that the NinjaTrader chart has fewer bars, hence fewer ticks.
Volman Style (70-tick chart)
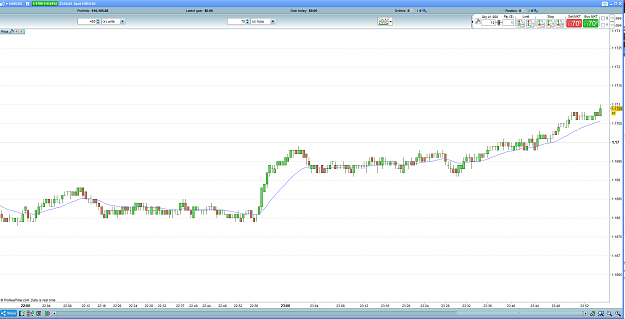
- FXBarbarian replied Jul 30, 2018
Here is a tick chart from the last London session for ProRealTime: image
Volman Style (70-tick chart)
- Posts by Member Search: 'FXBarbarian'