- Search Energy EXCH
- 8 Results
-
 EllisParrish replied Apr 16, 2015
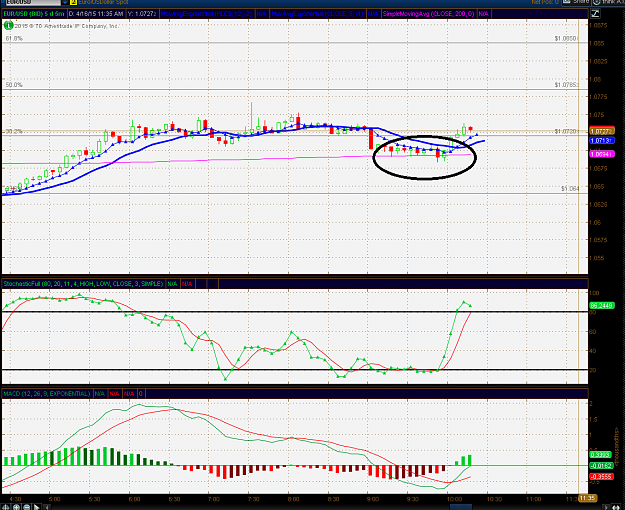
Hi Noob, Thanks for your observation. I have attached what I was viewing at the time I posted the comment. The pink line was my 200 SMA and the Fibonacci was above it. I am using TS software.
EURUSD
- EllisParrish replied May 23, 2014
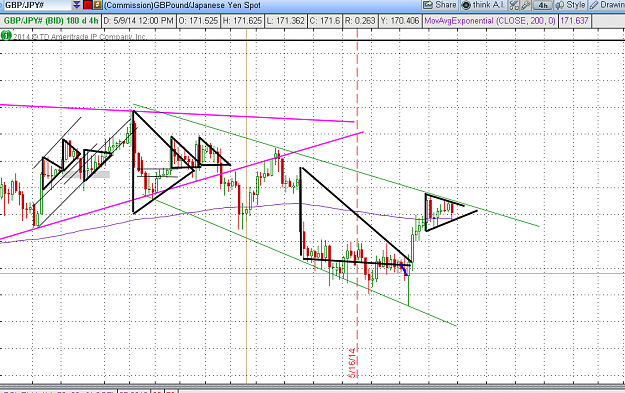
image Based upon the triangle formed above on a 4 hour chart: A break out occurs when we exit up through about 171.71 or so and will meet resistance at about 172.50 which has been a resistance line for about 4 weeks if not more, it could continue ...
Geppy's Geppy Thread (GBP/JPY)
- EllisParrish replied May 6, 2014
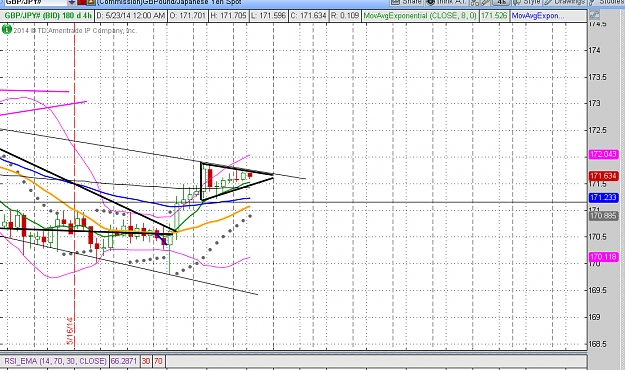
Since about 15:15 I have G/J trading in a range on a 15 minute chart between an upper 200 Day EMA of 172.33 and a lower 100 Day EMA of 172.25. Therefore a strong break out above 172.33 may go to 172.60 or below 172.25 thru 172.09 image to 171.80
Geppy's Geppy Thread (GBP/JPY)
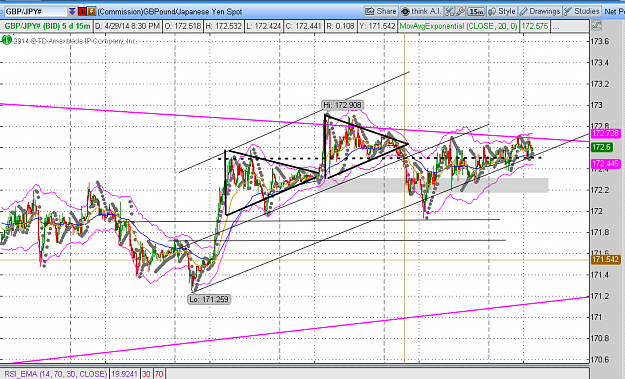
- EllisParrish replied May 1, 2014
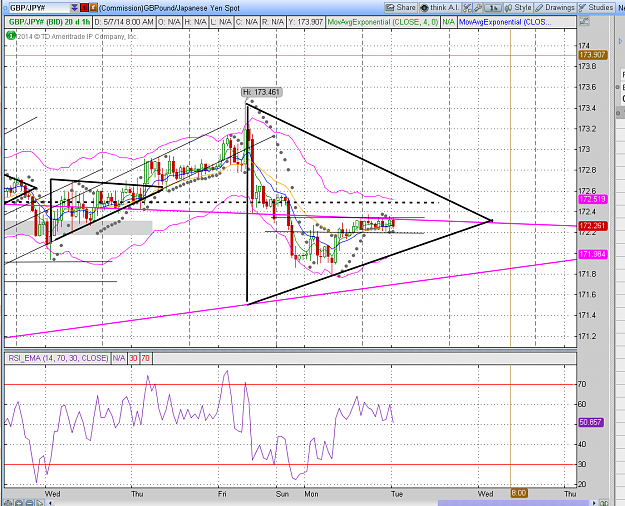
image Before Wednesday we had two pennants one broke up and one broke down With formation of the ascending triangle we have seemed to form an up trending S/R channel That, with no real strength, my opinion, broke us up and out over to new support ...
Geppy's Geppy Thread (GBP/JPY)
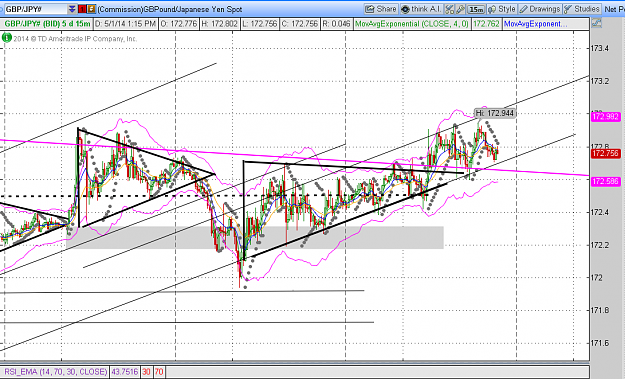
- EllisParrish replied May 1, 2014
image Two previous Pennants: One broke up and one broke down and the third one I alluded too earlier. The dotted line through the center is the 172.50 line which has been hanging around since Monday.
Geppy's Geppy Thread (GBP/JPY)
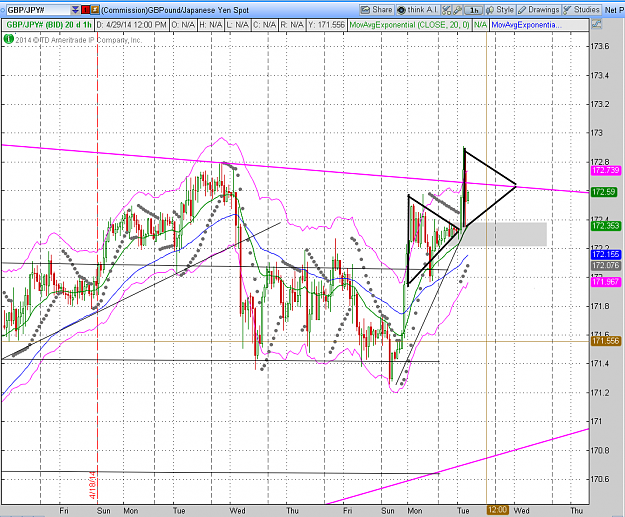
- EllisParrish replied Apr 29, 2014
image I'd suggest we have double pennants with a new 172.20/40 support and 172.8 resistance with same plays based upon R/S posted by Islander for the breakout / breakdown of the second pennant based upon news The U/J remains stable and in an up ...
Geppy's Geppy Thread (GBP/JPY)
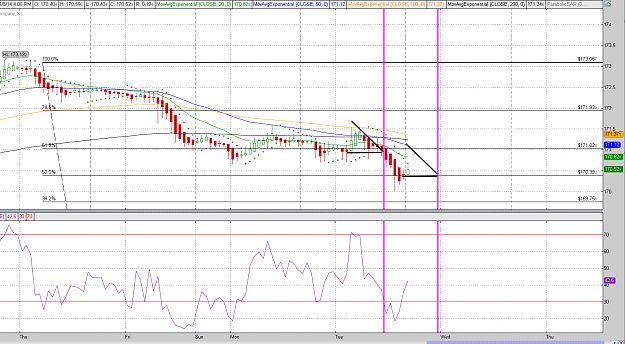
- EllisParrish replied Apr 8, 2014
Since I got caught in the last one, I will not get caught in this one... image
Geppy's Geppy Thread (GBP/JPY)
- Posts by Member Search: 'EllisParrish'