- Search Energy EXCH
- 153 Results (11 Threads , 142 Replies )
- The "Post Your Fractal" ThreadStarted Jun 14, 2012|Trading Discussion|0 replies

Premise: You can profitably trade single FX pairs using the default fractal indicator provided by ...
-
 Dirtybrown replied Jun 14, 2012
image I threw your EA on the chart with defaults on usdcad nzdusd, not bad!! Are these the kinds of results you are getting on 1 min??
System to hedge every major dollar pair for profit / low DD
- Dirtybrown replied Jun 14, 2012
Spread that good word! image
System to hedge every major dollar pair for profit / low DD

- Dirtybrown replied Jun 13, 2012
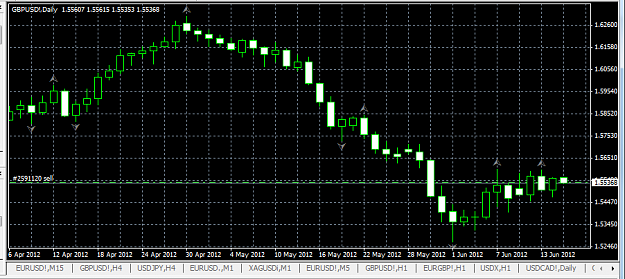
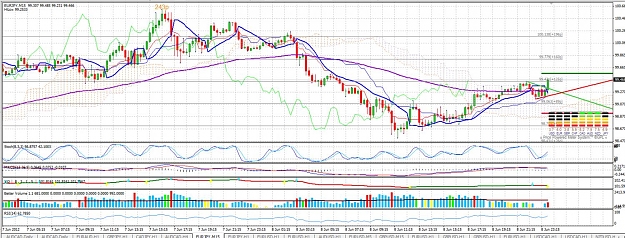
image EU looks good here on 4 hr.
Gann High-Low System with Laguerre/Fisher/VSA/Sixths and others
- Dirtybrown replied Jun 12, 2012
If you don't mind, could you please post your .set file for the EA? I'm thinking of trading it on th same pairs i've been using, usdcad nzdusd. What would be your recommendation based on this chart for the benefit of the thread? Thanks a million. ...
System to hedge every major dollar pair for profit / low DD
- Dirtybrown replied Jun 11, 2012
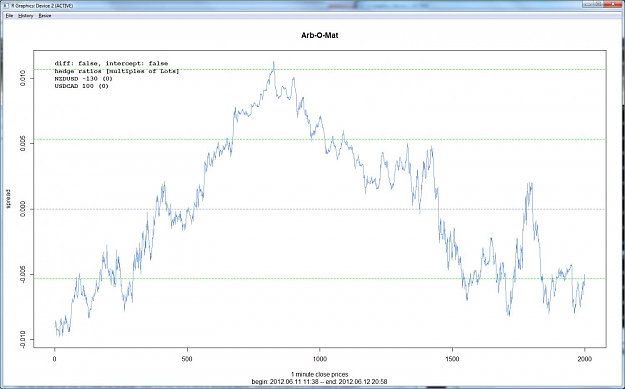
image With the weekend gaps now filled, I have re-established this hedge (both short) in the ratio shown. Notice the lower highs, lower lows........ Sound faimiliar?
System to hedge every major dollar pair for profit / low DD
- Dirtybrown replied Jun 9, 2012
Nice Sym, I think it will work welll with the attached demark indi used for support/resistence. I use an ichimoku trend system should do nicely, currently targetting eurjpy. I know there is a whole method behind demark. But you can simply use them ...
EA tool & strategy for semi-automatic interactive trading
- Dirtybrown replied Jun 9, 2012
Donny, here is my chart. image Can you please let us know where you originally found the indicator? thanks
System to hedge every major dollar pair for profit / low DD
- Dirtybrown replied Jun 7, 2012
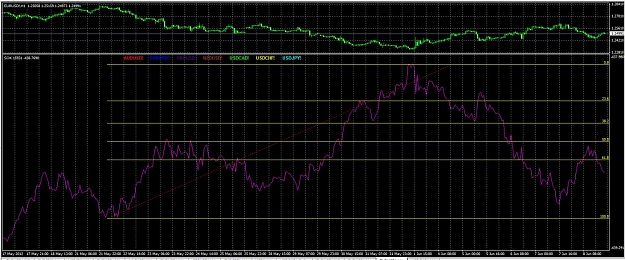
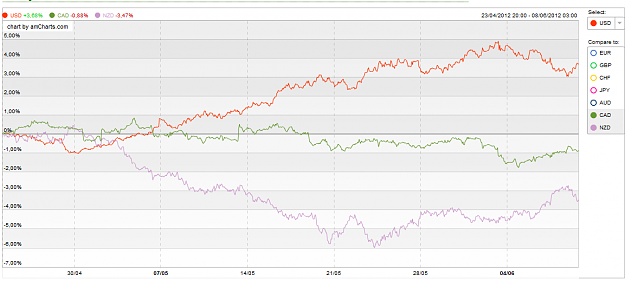
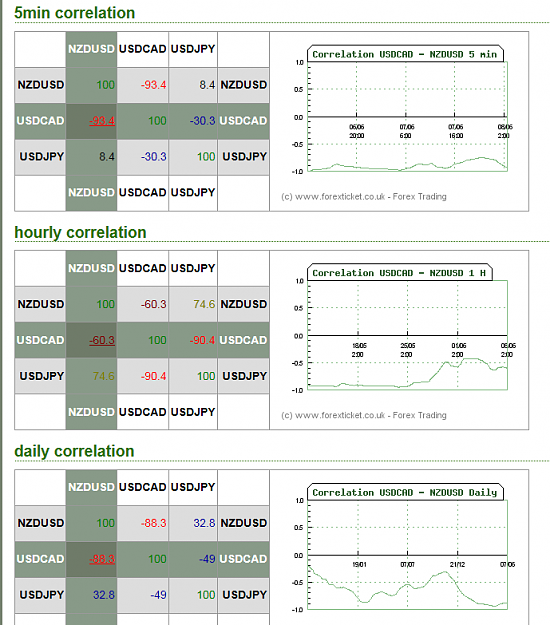
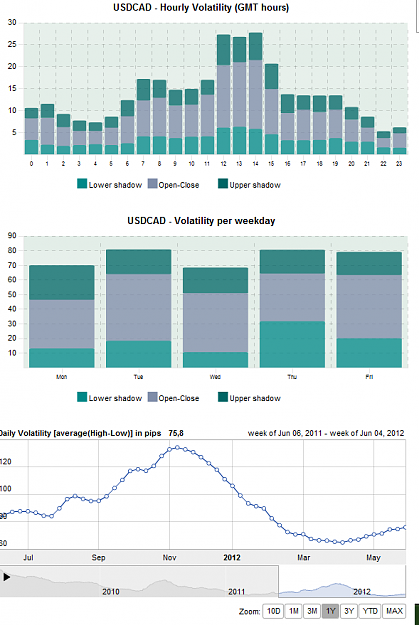
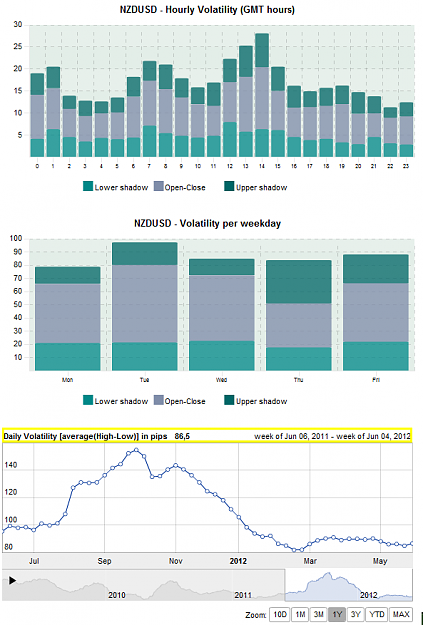
image image image Graphics from Forexticket Very interesting to see the difference in correlation between timeframe. This explains why 1 hr works so well, its one of the least correlated TF's. This is very important to know. Also notice the ...
System to hedge every major dollar pair for profit / low DD
- Dirtybrown replied Jun 7, 2012
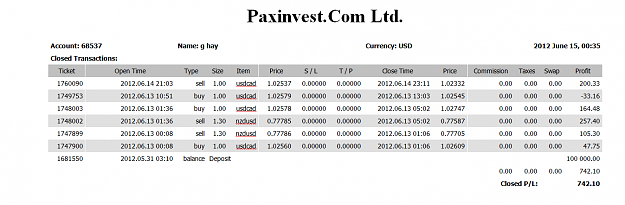
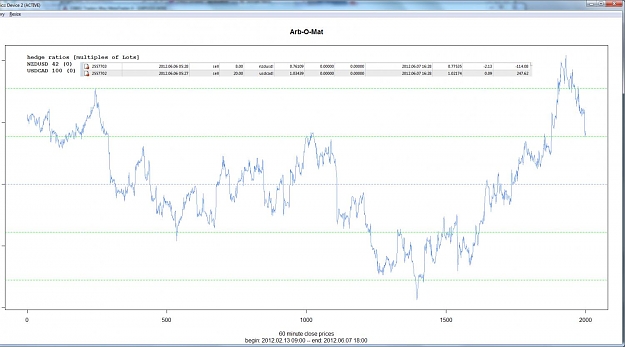
image Here's my closed trade, real money. Like magic, price has starting to bounce from the first deviation at this time. Again also note the hedge ratio BARELY changed from nzdusd, exactly same for usdcad. Therefore, this is a very passive ...
System to hedge every major dollar pair for profit / low DD
- Dirtybrown replied Jun 6, 2012
money shot — this is how we do it! image
System to hedge every major dollar pair for profit / low DD
- Dirtybrown replied Jun 5, 2012
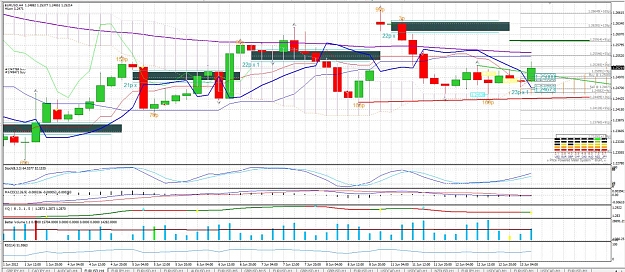
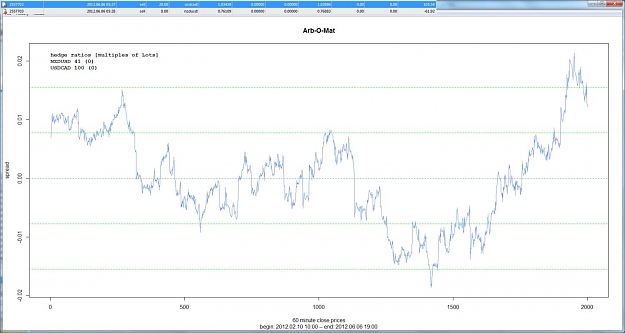
image Watching closely here for entry. The hedge ratios would reverse both portions. So an entry when price falls below the second horizontal blue line according to these ratios would be short both: .40 nzdusd to each 100 usdcad
System to hedge every major dollar pair for profit / low DD
- Dirtybrown replied Jun 5, 2012
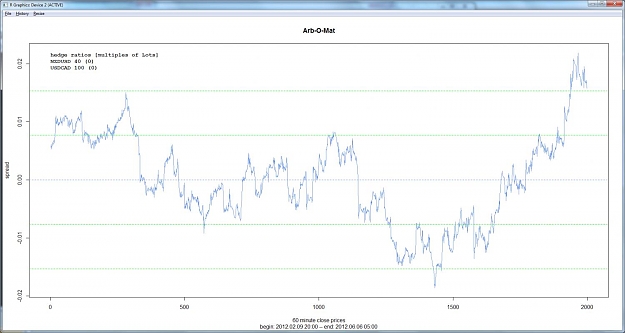
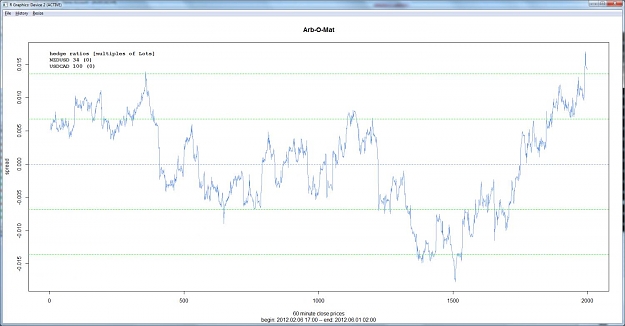
usdcad nzdusd — image Price action moderating after Friday's news. I'm taking note of each 500 price points as a cyclical measure
System to hedge every major dollar pair for profit / low DD
- Dirtybrown replied May 31, 2012
This is why you've suggested cointegration is not an ultra-short TF type of strategy correct? Since brokers give out less data on lower TF's. Could meshing 1 min TF data from historical sources with the live MT feed help overcome this challenge? ...
System to hedge every major dollar pair for profit / low DD
- Dirtybrown replied May 31, 2012
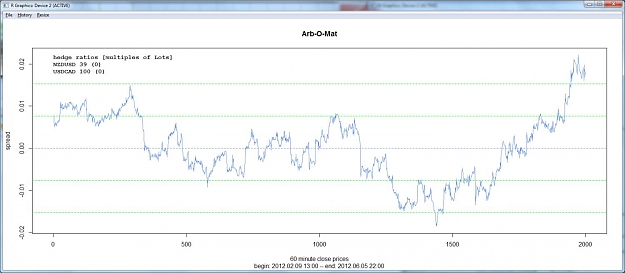
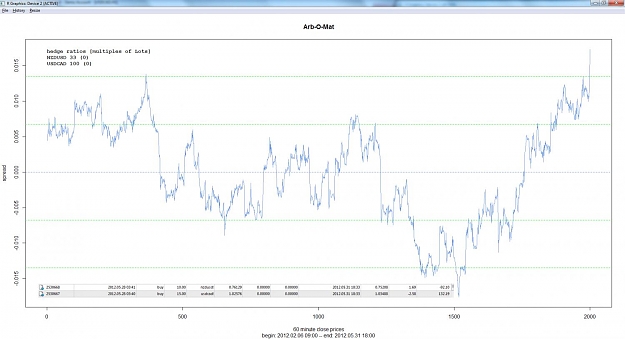
image All, here is my update on my live manual trade. nzdusd usdcad have hit the second deviation and I have closed the position as shown. This is arbomat demo on 1 hr data. Will wait to see some consolidation at the 2nd deviation above mean ...
System to hedge every major dollar pair for profit / low DD
- Dirtybrown replied May 30, 2012
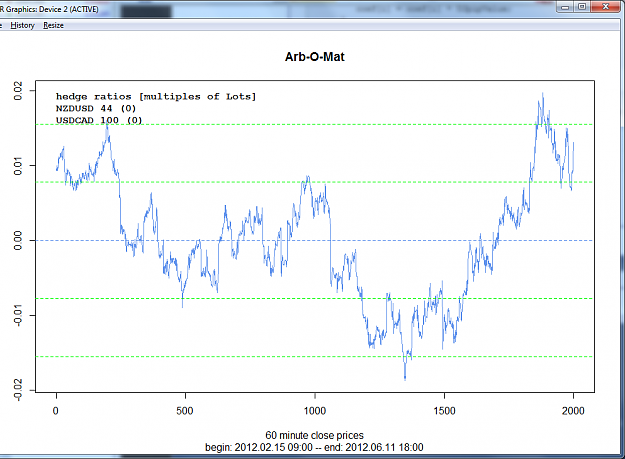
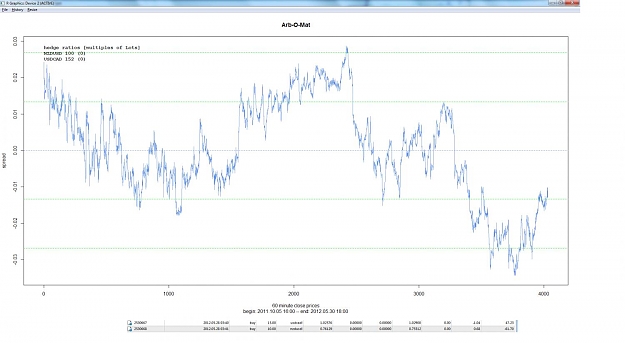
image update on my nzdusd // usdcad pair, live account This is the arbomatdemo version R chart
System to hedge every major dollar pair for profit / low DD
- Dirtybrown replied May 27, 2012
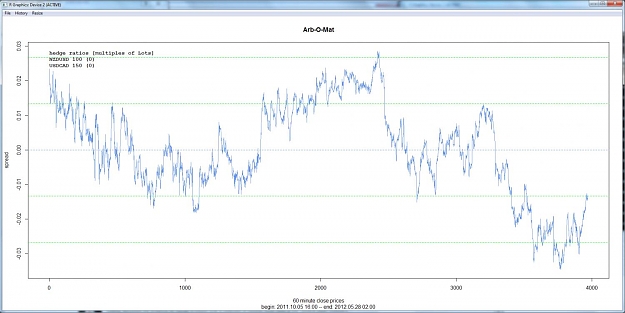
image Getting the expected retrace from the 1st deviation on nzdusd / usdcad, looking for further retracement before re-entry. Not sure where yet let's watch the hedges tell their story.
System to hedge every major dollar pair for profit / low DD
- Dirtybrown replied May 26, 2012
image puzuzu shall guide us
System to hedge every major dollar pair for profit / low DD

- Dirtybrown replied May 26, 2012
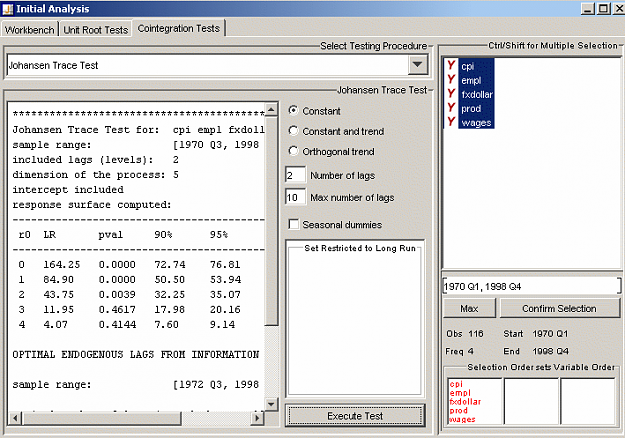
The Introduction should give people an idea of the need for error correction in statistical models. Bear in mind this is the art of estimation not necessarily a science: Since the critique of Sims (1980) in the early eighties of the last century, ...
System to hedge every major dollar pair for profit / low DD