- Search Energy EXCH
- 30 Results
-
 Chawl replied Apr 2, 2017
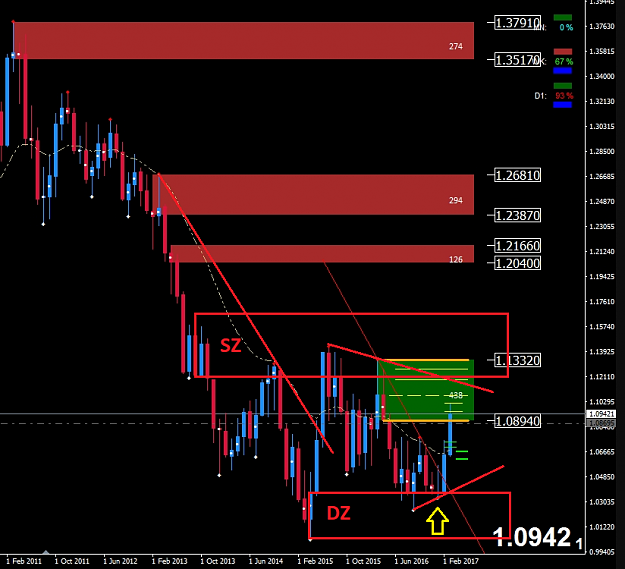
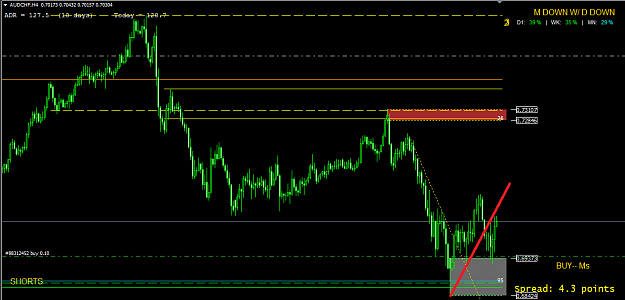
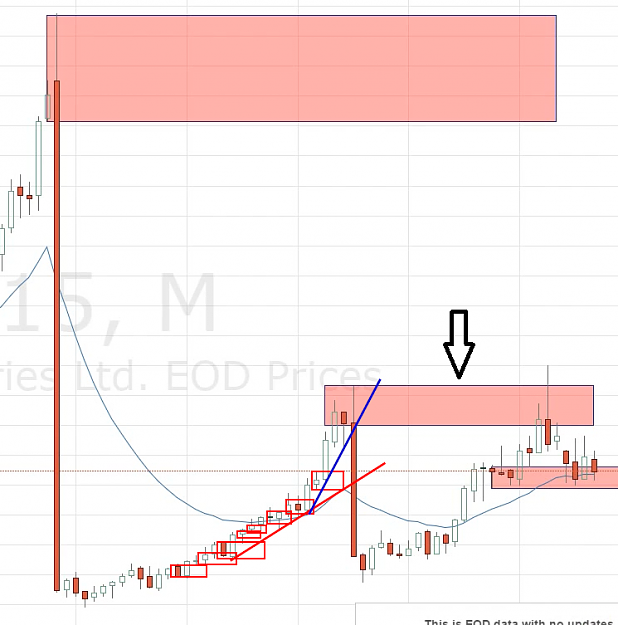
Let me share my view on your M1 AUDNZD chart. - There had to be a 'lover low' where the yellow arrow resides for the previous peak to be valid, so your trend line is not correct. I drew the correct one for that leg and other significant ones. - Your ...
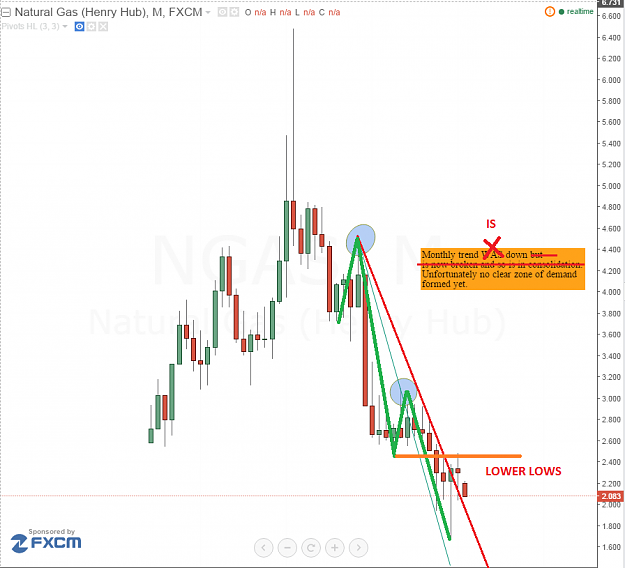
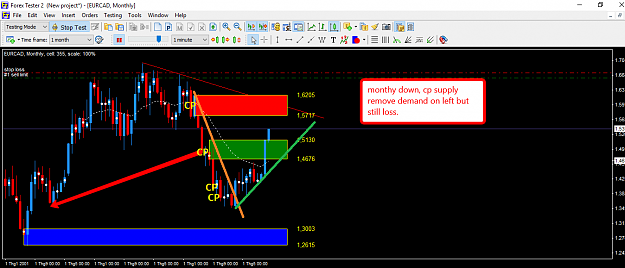
Supply and demand in a nutshell by Alfonso Moreno
- Chawl replied Nov 23, 2016
Hi all, I coded a very simple basing candle indicator for FXCM Trading Station in ten minutes
Supply and demand in a nutshell by Alfonso Moreno so don't expect much, it just marks 50% candles on the chart. Here is a screenshot: image To make it work: Exract Basing.lua from downloaded zip ...

- Chawl replied Jun 15, 2016
I'd like to note the stale weekly demand, I'd rather be watchful. AFAIK all FXCM accounts has MT4 support, you might think switching from TS to MT4 to use Alfonso's indicators.
Supply and demand in a nutshell by Alfonso Moreno
- Chawl replied Jun 11, 2016
+1 Edit: Let me put mine.
Supply and demand in a nutshell by Alfonso Moreno
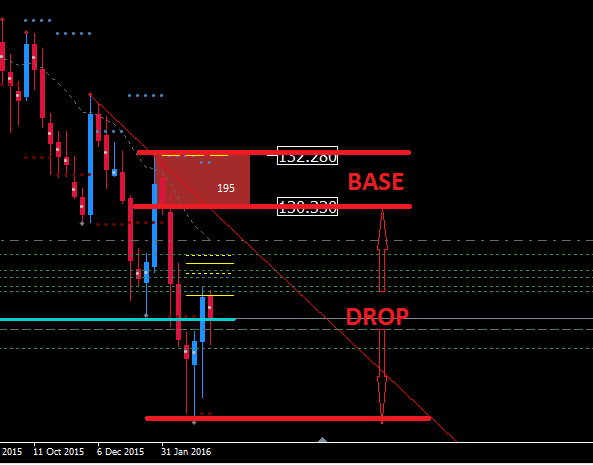
- Chawl replied Mar 16, 2016
As Alfonso said, measurement should happen in "drop", it should have at least 2 times much pips of the base, hence at least 2:1
Supply and demand in a nutshell by Alfonso Moreno
- Chawl replied Jan 7, 2016
AFAICS, your trend lines are wrong according to the rules comrade.
Supply and demand in a nutshell by Alfonso Moreno
- Chawl replied Jan 4, 2016
Hi Alfonso, First, I wish you and all a happy new year. If u wouldn't mind me asking, have you checked M.J.Huddleston's (ICT) "order block" method in any case? Though he suggests it differs from S&D zones, I think they are closely related. It might ...
Supply and demand in a nutshell by Alfonso Moreno
- Chawl replied Sep 15, 2015
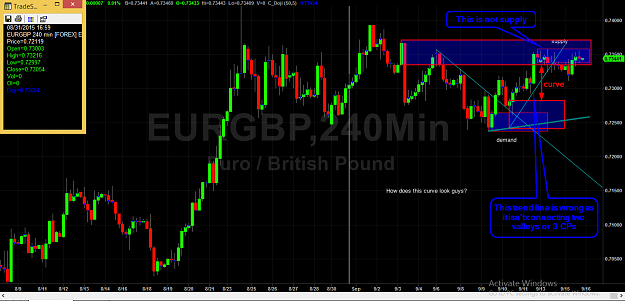
My curve is again somewhat different
Supply and demand in a nutshell by Alfonso Moreno Some remarks are on the image. I hope our last analyses have some truth in them, otherwise Alfonso will have many corrections to make tomorrow
- Chawl replied Sep 15, 2015
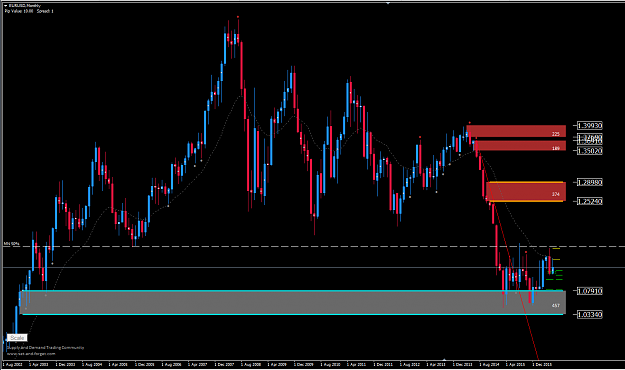
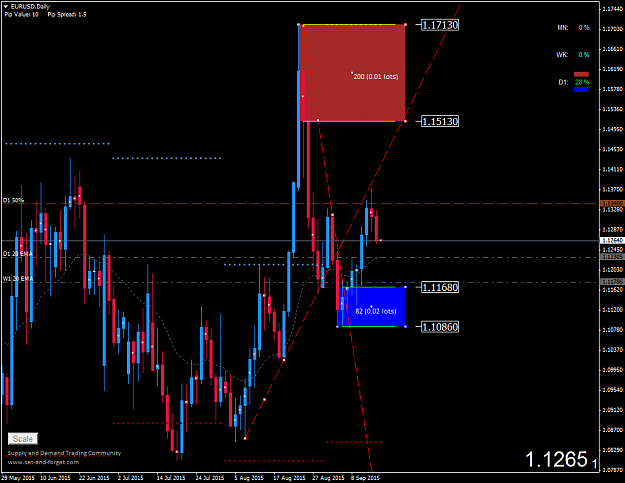
You are very welcome but sure it would be very nice if Alfonso confirmed my analysis
Supply and demand in a nutshell by Alfonso Moreno Yes, curve must be a part of the current move by definition as it is calculated according to the current price. My EURUSD analysis is somewhat different than ...
- Chawl replied Sep 15, 2015
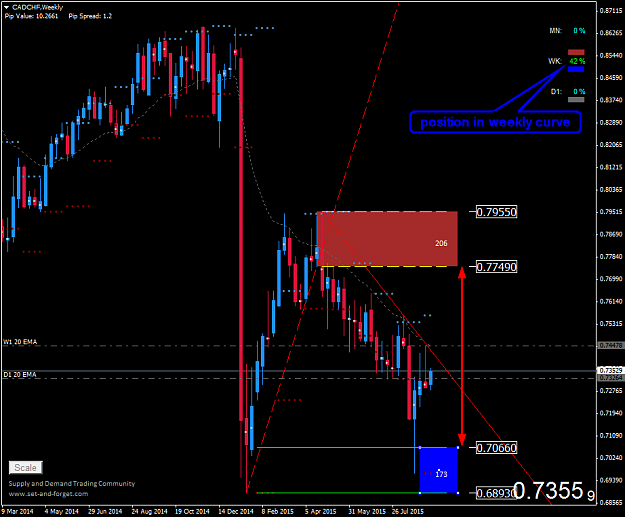
Curve is the span between the nearest supply and demand zones which are 'not' CPs but CADCHF monthly and weekly curves seem tricky as we have no demand zone in control but the all-time-low instead. So I subjectively preferred to use the 'lowest' ...
Supply and demand in a nutshell by Alfonso Moreno
- Chawl replied Sep 14, 2015
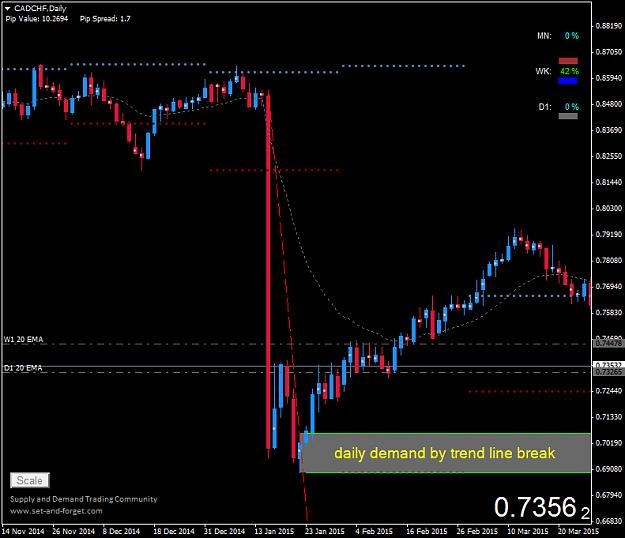
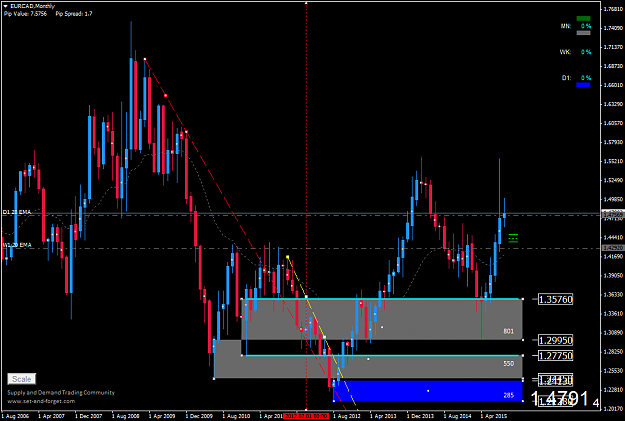
AFAIK we can draw trend lines using unvalidated zones and as we have way more than 3 consecutive CPs here, we can draw a more agressive one like the red. I sometimes even use trend lines like the blue one which connects last two CPs if there is no ...
Supply and demand in a nutshell by Alfonso Moreno
- Chawl replied Sep 8, 2015
I think your levels are also correct but it seems few are missed including the CP that Alfonso had drawn just because you neglect a flip zone and your chart is missing the trend line analysis. For example at the time of my vertical line, there would ...
Supply and demand in a nutshell by Alfonso Moreno
- Chawl replied Sep 7, 2015
Is this a marubozu demand and why, why not? IMHO it is because of flip and gap. Any comrades? Alfonso?
Supply and demand in a nutshell by Alfonso Moreno
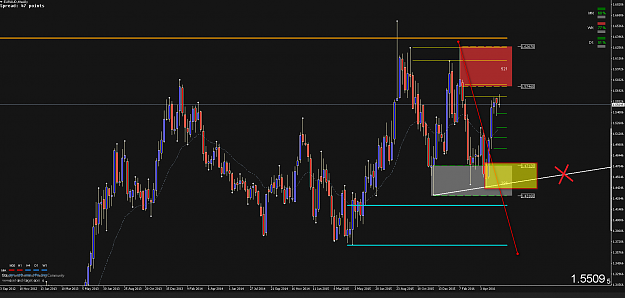
- Chawl replied Sep 4, 2015
+1 to your analysis and I had made a very similar one. The only reason why I didn't get the trade (in fact closed it immediately because of fear) was my dashed trend line on H4 but Alfonso kindly cleared this also few messages ago.
Supply and demand in a nutshell by Alfonso Moreno
- Chawl replied Sep 4, 2015
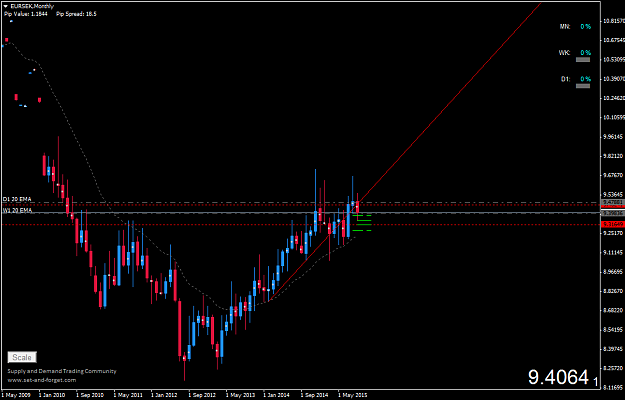
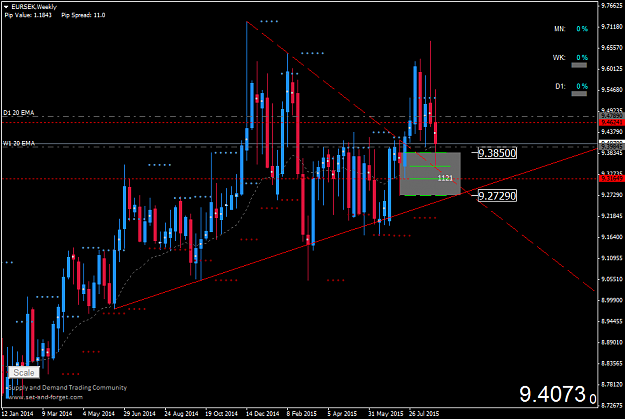
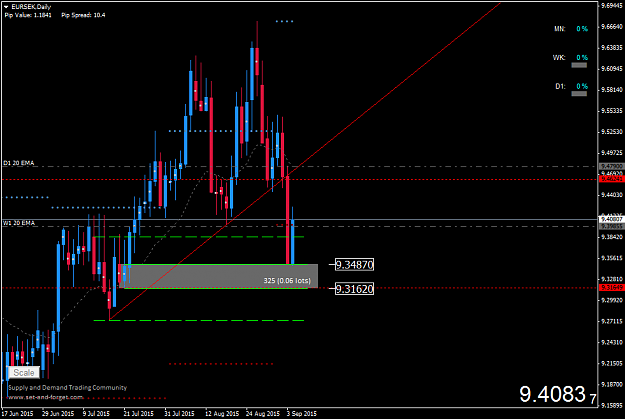
I'm not sure if we are all shorts on EURSEK but longs istead. M-Long W-Long D-(technically) long as last bar is open, previous touches the trend line and price reacting to a daily demand.
Supply and demand in a nutshell by Alfonso Moreno
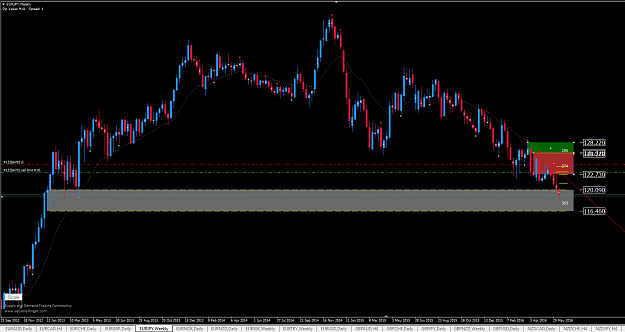
- Chawl replied Sep 4, 2015
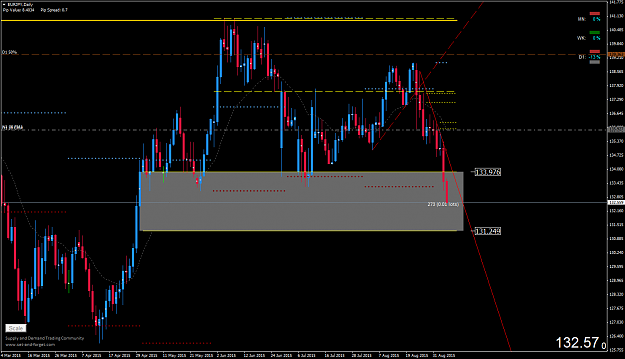
I have the same analysis and I'll try to short EURJPY somewhere convenient next week but we are in a huge daily demand in control that you might have missed in your analysis, though it won't affect my shorting plan as half of it is already consumed ...
Supply and demand in a nutshell by Alfonso Moreno
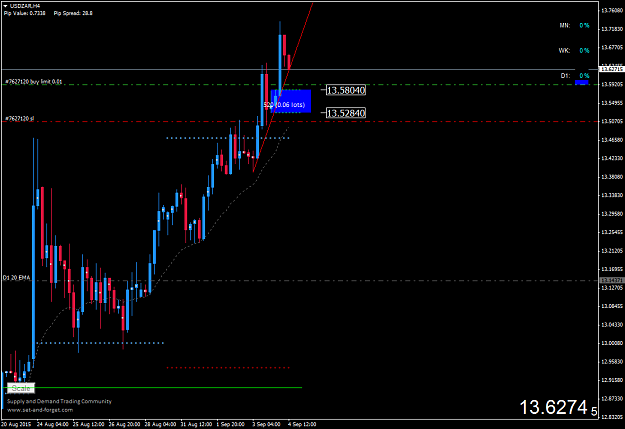
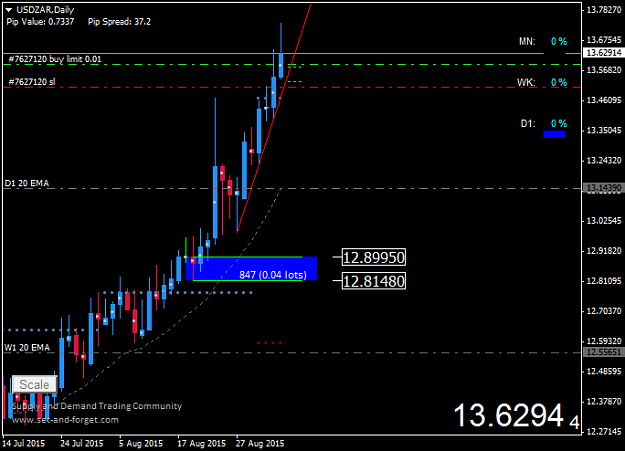
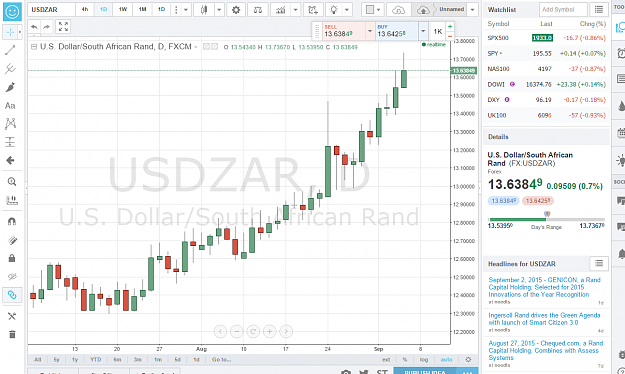
- Chawl replied Sep 4, 2015
I have a tiny pending buy on the same H4 level but my H4 trend line is aggressive than yours. Also my broker's MT4, my broker's other trading platform, generic MT4 and tradingview.com don't have a daily bar which is reaching 14.00000+ on 24th August ...
Supply and demand in a nutshell by Alfonso Moreno