- Search Energy EXCH
- 74 Results
-
 Carlicus replied Sep 1, 2014
Good mornin my dear friend! I hope you are doing well, as always
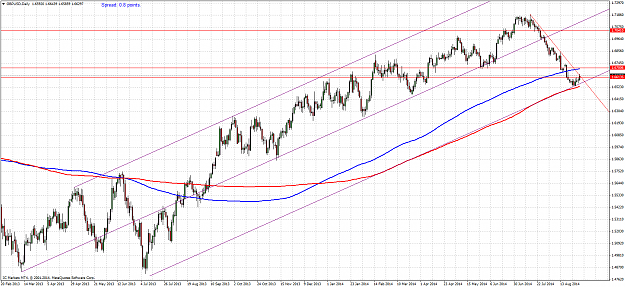
Cable Update (GBPUSD) This is my last analysis image I have modified a little bit the long term pitchfork so that the upper part fits better the uptrend. I have plotted two SMA, the blue one is a 200 ...
- Carlicus replied Aug 20, 2014
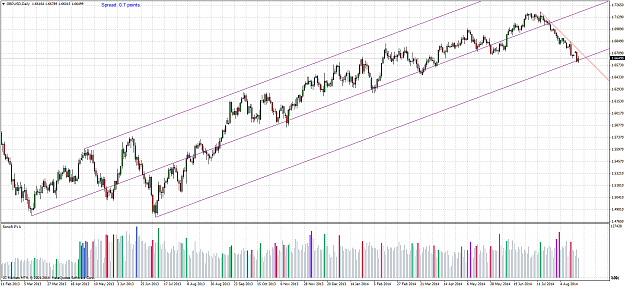
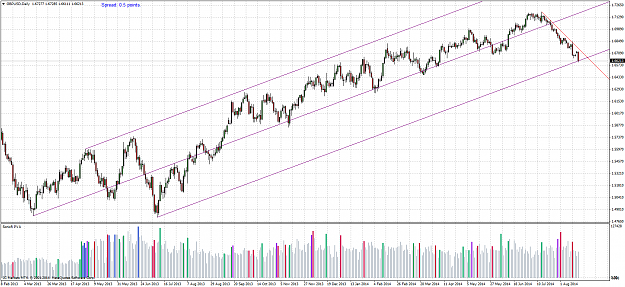
Coincidence or not, the price has rebounded the lower line of the long term pitchfork. A breakout of the red down trend line would be wonderful for my longs
Cable Update (GBPUSD) However we are still below the 200 SMA (blue)
- Carlicus replied Aug 19, 2014
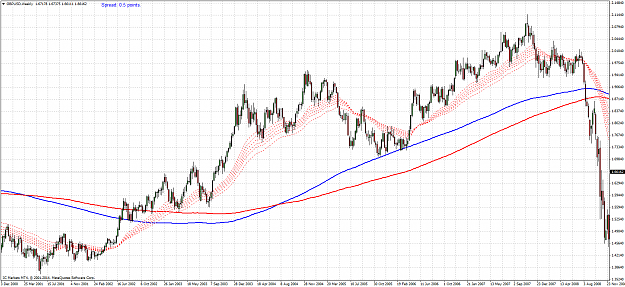
Continuing with the Slow Guppy Moving Averages (GMMA), you can see in these weekly long term chart (2001-2008), how well the price responded to the slow GMMA. The chart speaks on its own
Cable Update (GBPUSD)
- Carlicus replied Aug 19, 2014
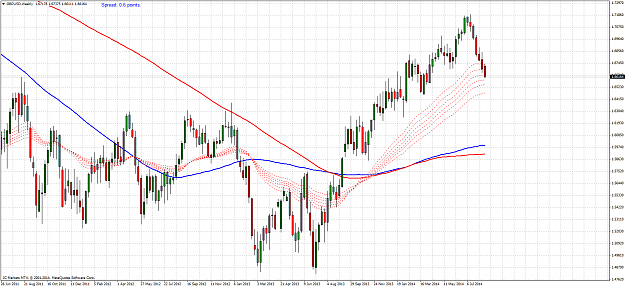
Another interesting chart in my opinion. It is a weekly chart, where the price is entering the territory of the Slow Guppy Moving Averages (30, 35, 40, 45, 50 and 60 SMA). This hasn't happen in a year, so even if the price can drop more, of course, ...
Cable Update (GBPUSD)
- Carlicus replied Aug 19, 2014
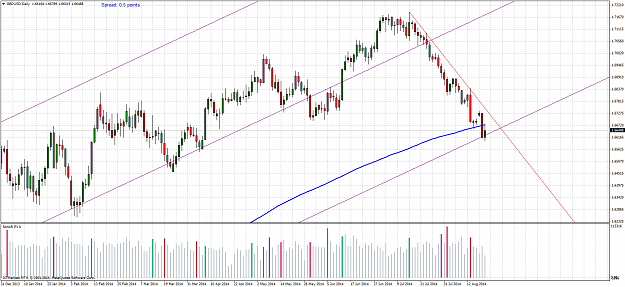
We are on the lower line of a pitchfork I posted loooong long time ago I've added some longs there to my previous ones
Cable Update (GBPUSD)
- Carlicus replied Aug 14, 2014
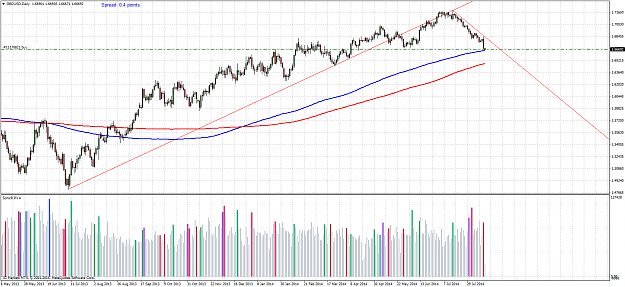
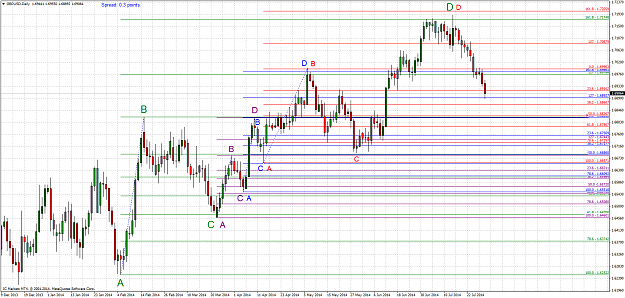
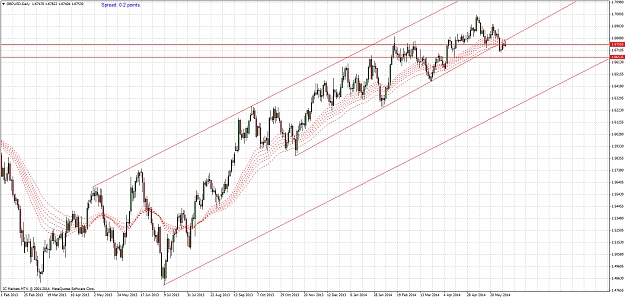
Long @1.66726 Price has touched my SMA 200 (in blue, the red one is SMA 261) Price is approaching the 23.6% fib retracement from July 2013 Price is about to touch the lower line of an Andrew's pitchfork traced from July 2013. Enough resons to try a ...
Cable Update (GBPUSD)
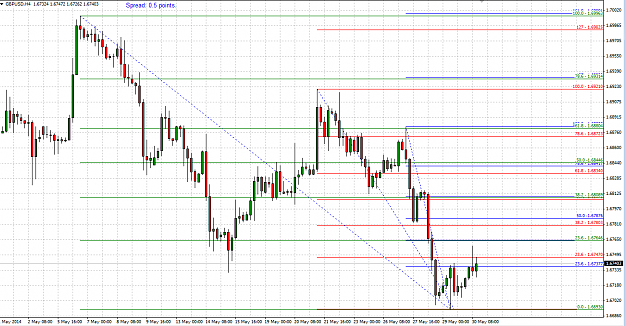
- Carlicus replied Jul 30, 2014
Here you have the chart updated. Would you like me to trace some more fibs?
Cable Update (GBPUSD)
- Carlicus replied Jun 10, 2014
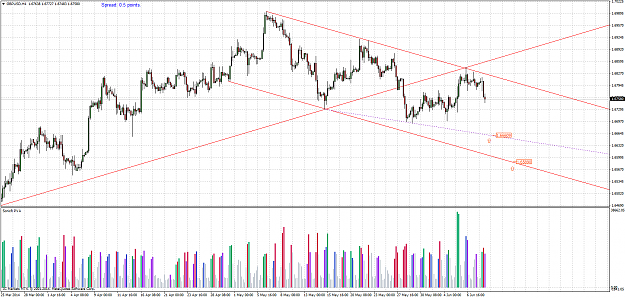
Update of my current shorts according to the downtrend channel. I'm waiting for the price to get at least to 1.67. If it the PA seems strong to the downside, I'll wait for 1.666 or even for 1.658-1.66 which would be my preferred TP, since it is the ...
Cable Update (GBPUSD)
- Carlicus replied Jun 9, 2014
Good evenin' dear fellows
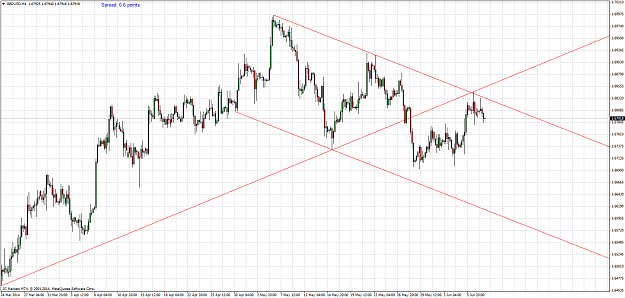
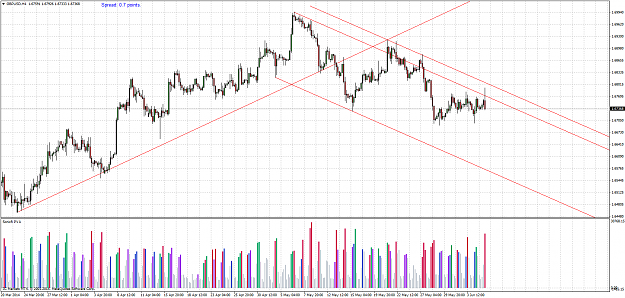
Cable Update (GBPUSD) This is my updated view on cable. I did not say much today cause I'm patiently waiting for a selloff while the price is contained within the downtrend channel. I would like to have enough patience to close my shorts when ...
- Carlicus replied Jun 6, 2014
Thanks Billy!
Cable Update (GBPUSD) What do your EMA's say, bro? A break below 1.6780 would be great, wouldn't it?

- Carlicus replied Jun 6, 2014
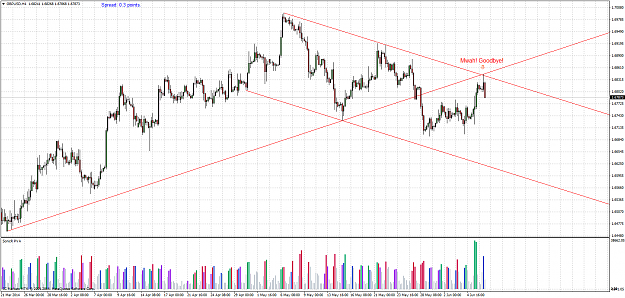
I've slightly adjusted my down channel, now it looks much better
Cable Update (GBPUSD) As JimmyC said, this last spike up may have been a goodbye kiss to the long term uptrend line.
- Carlicus replied Jun 5, 2014
I agree with your chart, the channel I pictured says if 1.67 is gone, we could see 1.65x
Cable Update (GBPUSD)
- Carlicus replied Jun 3, 2014
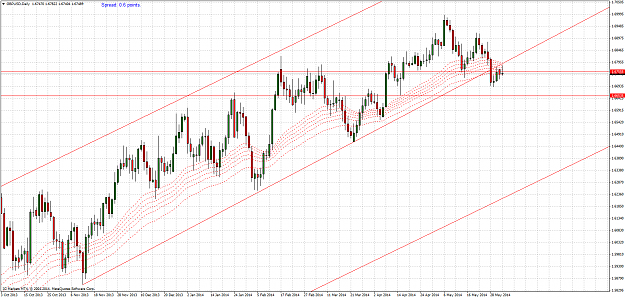
In a daily timeframe, the old rising trendline starting on Nov 2013 has been broken, and a pullback has been made to that trendline. Additionally, as you can see, I have plotted in dashed red the slow Guppy Moving Averages (GMMA), and now we are ...
Cable Update (GBPUSD)
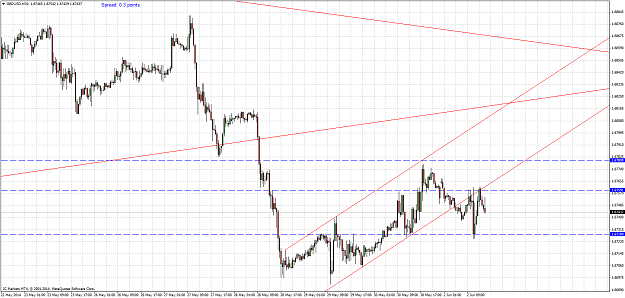
- Carlicus replied Jun 3, 2014
Another pullback to the base of the channel I previously drawed, which coincides with previous support @1.6780, now turned resistance. 1.6760 is resistance now, let's see if it holds the price or not. To me this movement from 1.669 totally looks as ...
Cable Update (GBPUSD)
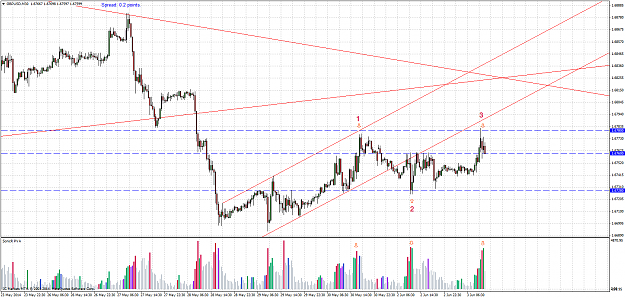
- Carlicus replied Jun 2, 2014
The channel I posted on friday seems to work , as well as some support and resistance levels I plotted (in dashed blue):
Cable Update (GBPUSD)
- Carlicus replied May 30, 2014
Don't know if is the time, but I did it. Short @1.6776. Hope we are doing it right
Cable Update (GBPUSD) And I hope PoundTrader doesn't slap me as yesterday haha
- Carlicus replied May 30, 2014
A nice overlapping zone seems to be 1.68, previously was also a support
Cable Update (GBPUSD)
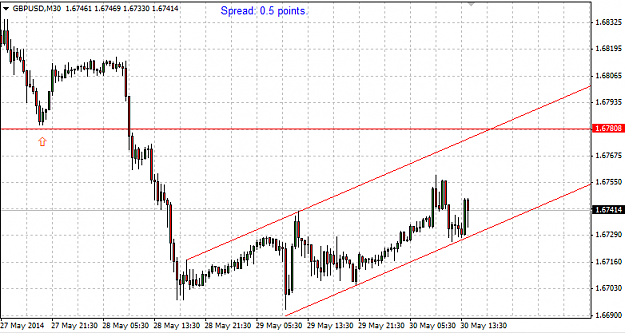
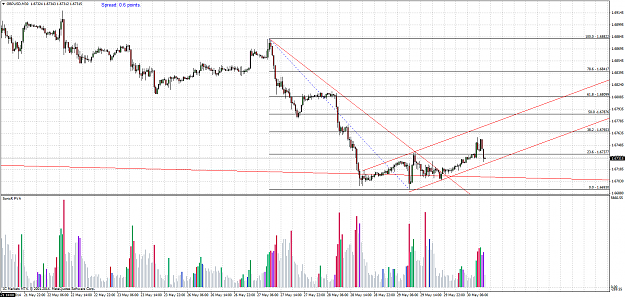
- Carlicus replied May 30, 2014
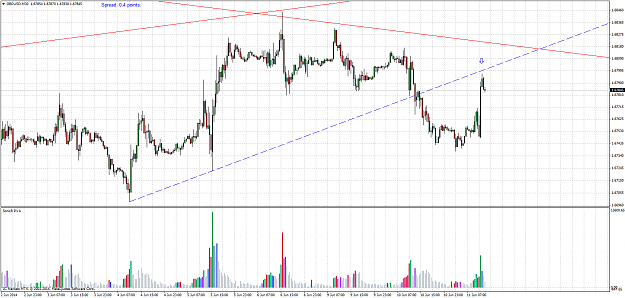
Damn, my TP almost hit, I should have stayed in! Anyway it was a bit risky I know some people say forex tick volume is useless, but to me volume analysis clearly supported a small bounce like this.
Cable Update (GBPUSD)
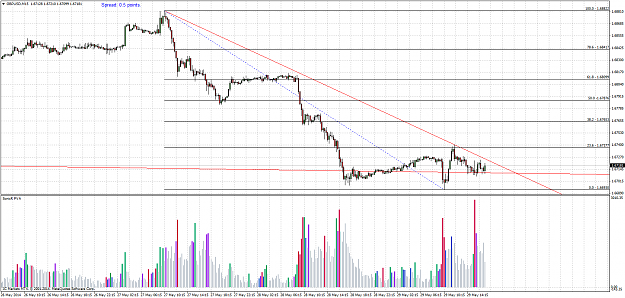
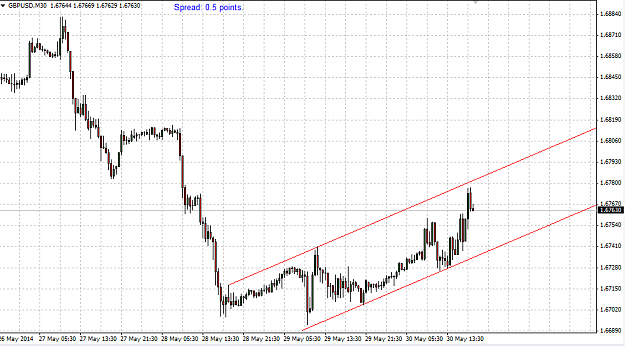
- Carlicus replied May 29, 2014
I'm trying to scalp some pips on the long side, let's see what happens if the price breaks through the down trendline. A nice TP could be 1.6765
Cable Update (GBPUSD)