- Search Energy EXCH
- 12 Results
-
 Bhoopalan replied Aug 28, 2013
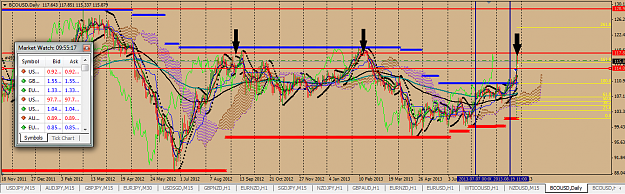
image Daily chart. The price around 117 was around August 2012 and it formed a double top again at February of this year. Now it has hit that price in an aggressive movement and starts pulling down... I'm not sure if this is a beginning of a ...
Oil and Natural Gas
- Bhoopalan replied Aug 23, 2013
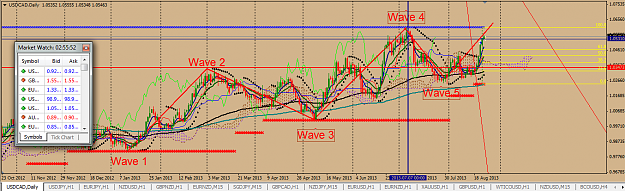
I don't think this is going to go short very soon. If such a short trend forms, the short wouldn't be in long term. image This is the daily chart of USDCAD. I believe it forms a closure version of Elliot Wave since the beginning of this year. So ...
USD/CAD
- Bhoopalan replied Aug 20, 2013
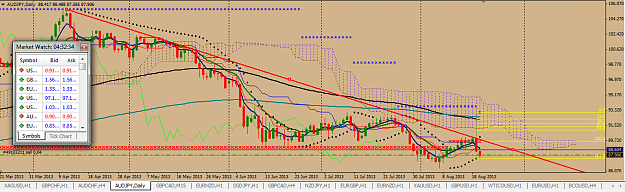
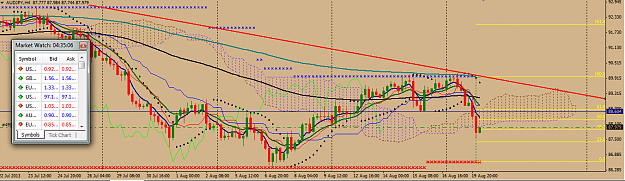
On a daily basis. The previous uptrend seems like a correction and the downtrend now seems to continue... ?? Daily chart: image On H4, it didn't only form an 'M' aka double top, it was also not able to cross the 200 EMA. It was fighting between ...
AUD/JPY
- Bhoopalan replied Jul 11, 2013
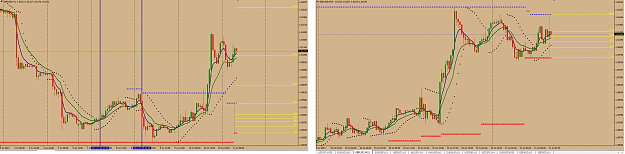
Little confusing. But I'll be happy to learn. image Left is the H1 chart and right is M15 chart. They look similar isn't it? So how does this give a signal? That is where I'm finding it hard to understand. You said we can use any strategy and set ...
The similarity system
- Bhoopalan replied Jul 8, 2013
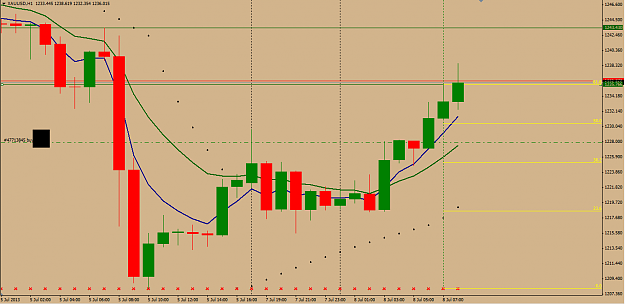
Gold seems to reverse pretty good. All indicators I use say that only. It is not often that all my indicators point equally. As you can see in the image below, fib 61.8 (1235.76) was almost last hour's high and this hour also it is going strongly ...
Only Gold!
- Bhoopalan replied Jun 28, 2013
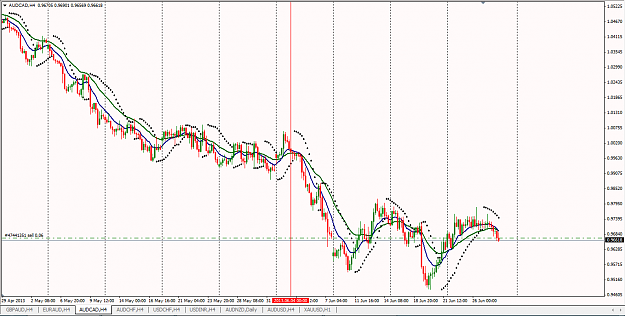
Hey guys no activity on AUDCAD for so long? I hope AUDCAD has been trending well recently. what do you think about AUDCAD right now? It's in downtrend on H4 and daily basis. I've shorted at 0.96711. Hoping it would reach another lower low according ...
AUDCAD
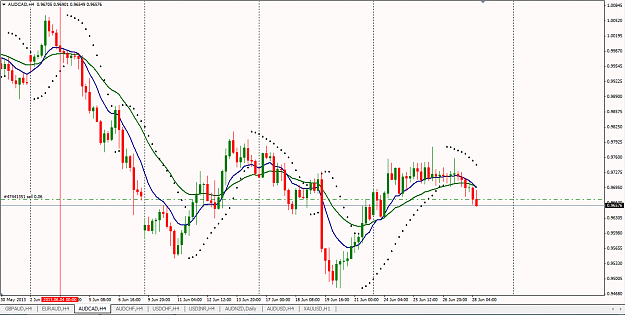
- Bhoopalan replied Jun 28, 2013
Hey guys what do you think about AUDCAD? It's in downtrend. I've shorted at 0.96711. Hoping it would reach another lower low according to the trend. However, it may not be there within today. You would suggest leaving the order opened in weekend? ...
Aussie Trading Room and Cartoons Gallery
- Bhoopalan replied Jun 14, 2013
I'm sorry, I was referring to AUDCHF. The long term trend has been down based on pure price action. Th trend seems down also in H4. It also looks like the trend reverses. But unsure.
Aussie Trading Room and Cartoons Gallery
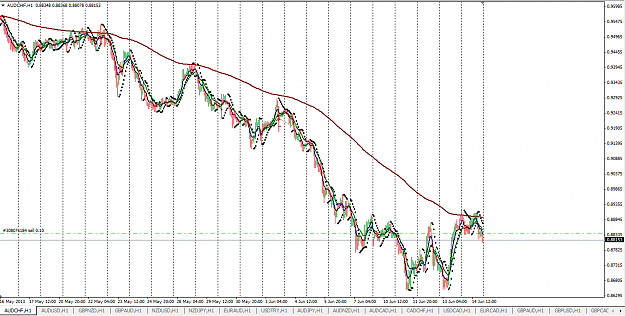
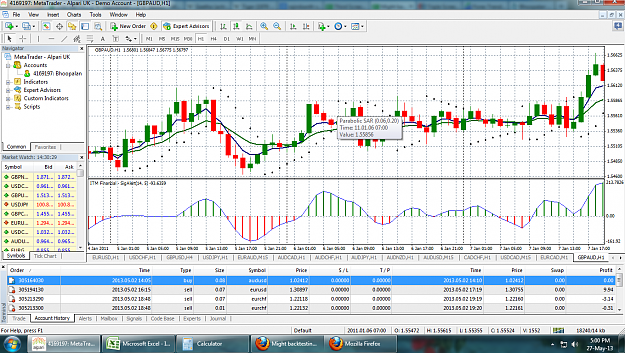
- Bhoopalan replied May 27, 2013
That's the problem. I couldn't explain properly. Could the historical data I see in MT4 go wrong? According to the historical data of Jan 2011, GBPAUD chart was like this: image Would this have been the exact chart even if you were watching the ...
Is an indicator less accurate the further back in time you go?
- Bhoopalan replied May 3, 2013
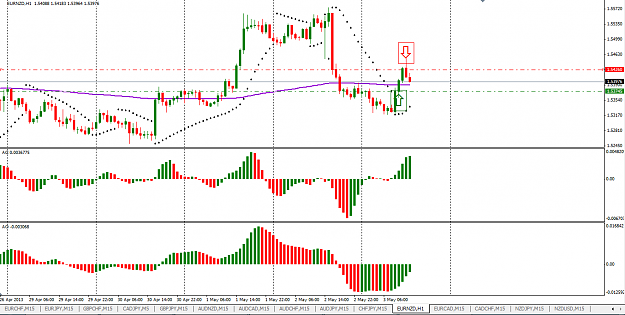
Another trade I was watching closely but missed at the right time. I show below: image image The green Arrow is where u could've entered the market and the red arrow is where the TP of 50 Pips hit. EURNZD,H1 Chart. Trade duration is around 3 ...
Accurate Trading Strategy
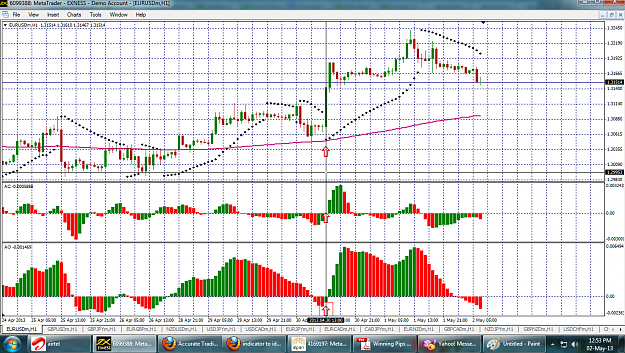
- Bhoopalan replied May 2, 2013
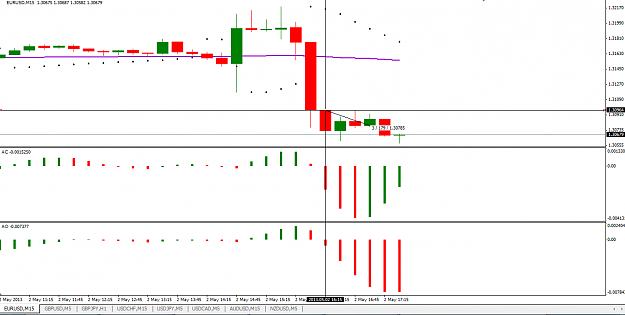
Below is the chart. I've used the crosshair tool to specify the entry and exit point. I've marked the same using Black down arrow and up arrow also. A question to Ochuko: I've also marked a candlestick using a red arrow. As soon as this candlestick ...
Accurate Trading Strategy
- Bhoopalan replied May 2, 2013
image In the above chat, I've added 3 Up arrows in a straight line. On this candlestick, the 200 EMA is also below the candlestick. So this is the kind of candlestick you're referring to right?? I mean we can go long on the beginning of the next ...
Accurate Trading Strategy
- Posts by Member Search: 'Bhoopalan'