- Search Energy EXCH
- 46 Results
-
 Baillie replied Nov 19, 2014
Sure, here you go.... image
MTH Accel Shift- Advance Renko Trading System (ARTS) MT4 b600
- Baillie replied Sep 19, 2014
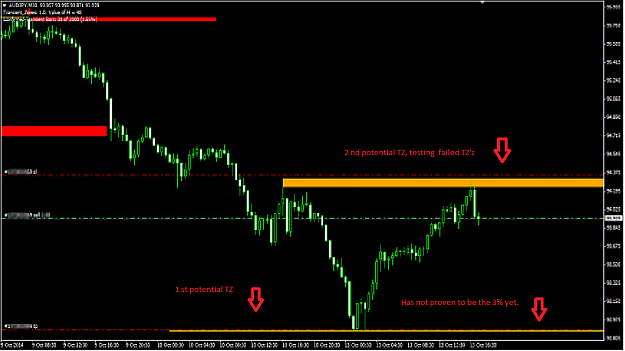
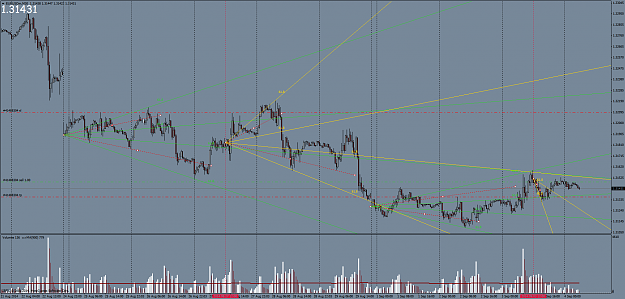
I shouldn't do this, but, I do not use any of the indicators for identifying TZ Zones, I stay on the 4hr, 1hr, 30 min charts zoomed out a bit; to get a better picture. Look to your left for "clusters of prices" 2-3 bars or more, pick a price closest ...
The similarity system
- Baillie replied Sep 19, 2014
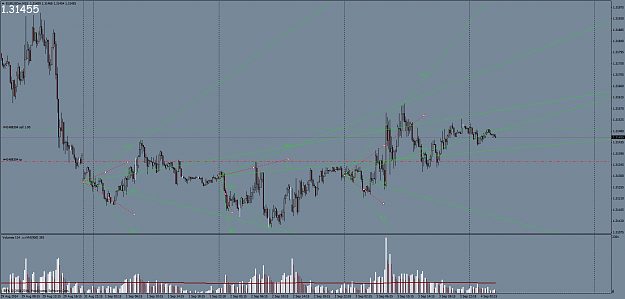
Price just hit my second target, see pic. I knew it would, but being Friday and I just got up, no need to be greedy!
The similarity system
- Baillie replied Sep 15, 2014
Morning, got my pips for the day and the day is just starting for me. 2 trades +28 +37 The rest of NY will be icing on the cake. Just a thought for everyone, EURUSDD has 14 different parameters that are being programmed into his trade strategy at ...
The similarity system
- Baillie replied Sep 14, 2014
Here is another concept that EURUSDD promoted in another one of his threads, have these targets been hit before they have left the screen? YES, except 2, but it still has a little time to work out. Even if 2 does not get hit that is 9 out of 11, not ...
The similarity system
- Baillie replied Sep 14, 2014
We have similar ideas; concept. This strategy has already been posted so Im not sharing a "secret", thanks, Hepsibah. The probability of a transient zone being a long term turning point is very low and the smaller h is, the lower this probability ...
The similarity system
- Baillie replied Sep 10, 2014
Here is another Hybrid B2i that I came up with based upon this posting, again very interesting stuff. The idea was to keep all boxes interconnected by the last B2i box, high or low. image
Funny Looking Rectangles & Useless Drivel
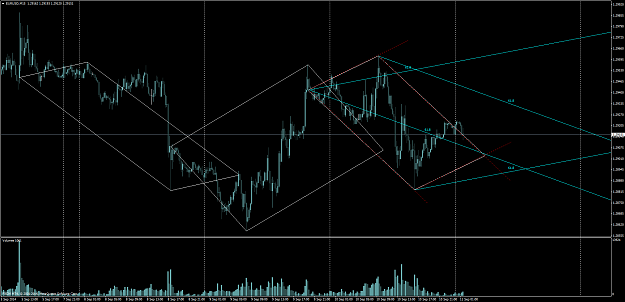
- Baillie replied Sep 4, 2014
Here is another concept I dreamed up this week, use the 12:00 Wednesday candle as the end of box limit and project from the open of the week. Red vertical line is the 12:00 candle. 1/2 Week projection. image
Funny Looking Rectangles & Useless Drivel
- Baillie replied Sep 4, 2014
Hi Double, I have been messing around with the boxes and fans based upon your postings, they are FAN tastic, in my opinion. I took the fan concept and reduced the fan to 61.8 as your pics show. Well, I had an idea to add a -61.8 to the fan so it ...
Funny Looking Rectangles & Useless Drivel
- Baillie replied Aug 19, 2014
Someone was asking what to do if the market starts a trend from the open and does not produce either a new high or new low, can't find the post right now but, this is what I do; use the previous days open line. In this example I used yesterdays High ...
Funny Looking Rectangles & Useless Drivel
- Baillie replied Aug 17, 2014
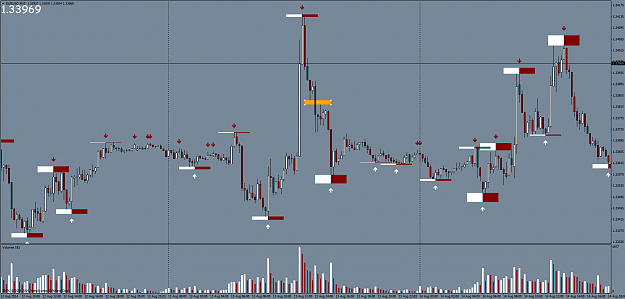
Here is an example of what i am talking about: orange rectangle. image
The similarity system
- Baillie replied Aug 13, 2014
3 pages in 6 hours, seems like old times
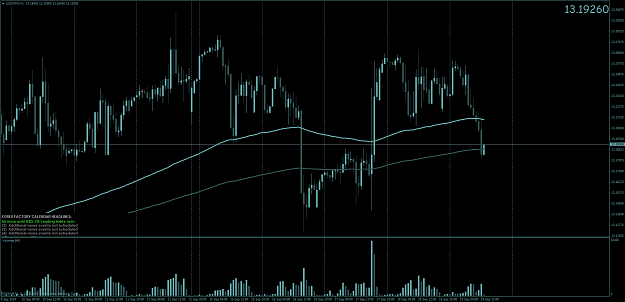
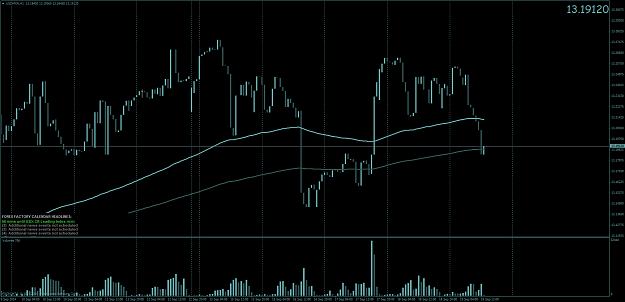
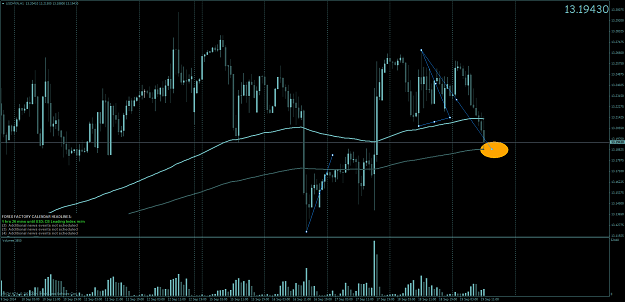
The similarity system Well this level held as resistance price made it to 1.3372 then fell like a rock, made some nice pips while sleeping
 Looks like this level will be tested again soon, my evidence is on the 5 min ...
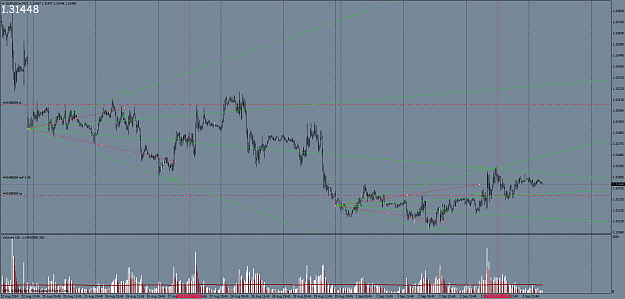
- Baillie replied Aug 12, 2014
Back to relevant matters, I posted a pic earlier in this thread of an observation I had which is marked with a horizontal line in white. image
Funny Looking Rectangles & Useless Drivel
- Baillie replied Aug 12, 2014
Here's a rectangle and other useless drivel, enjoy
Funny Looking Rectangles & Useless Drivel
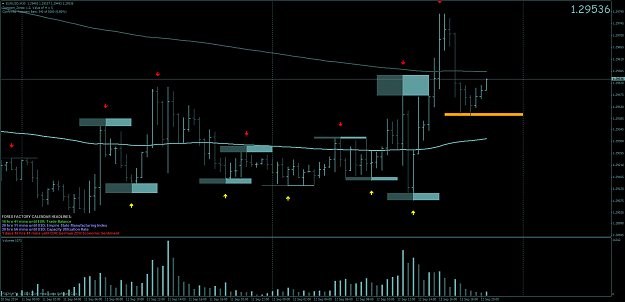
- Baillie replied Aug 12, 2014
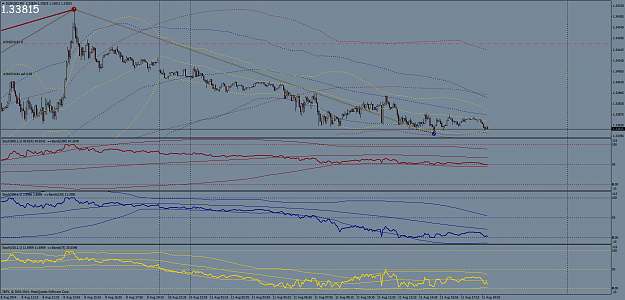
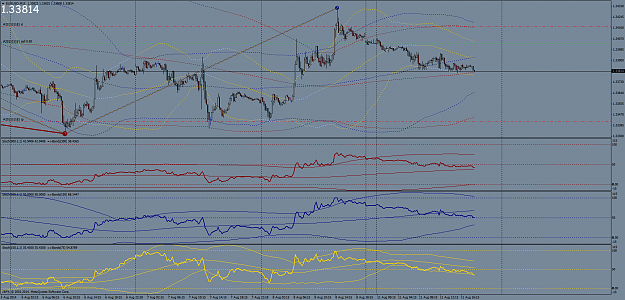
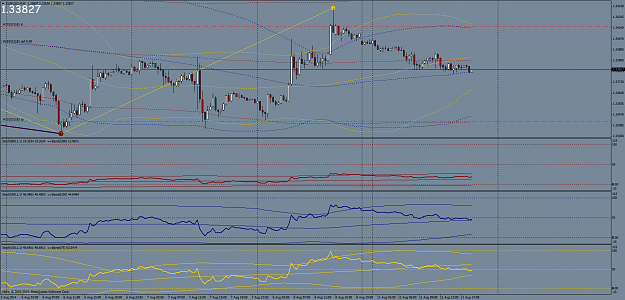
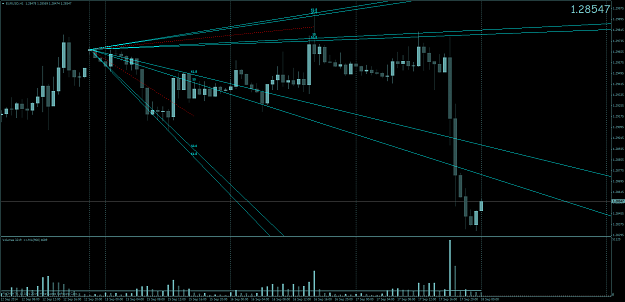
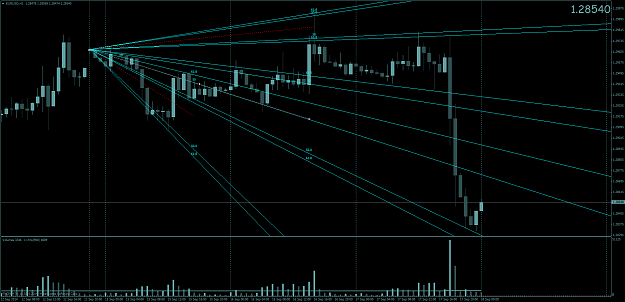
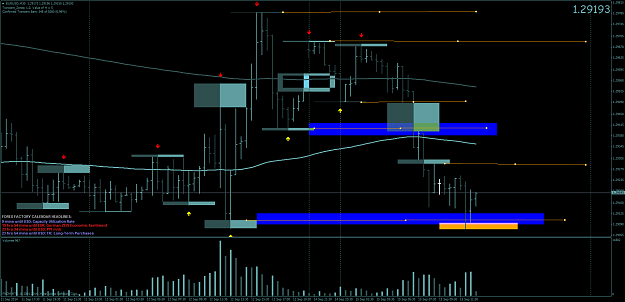
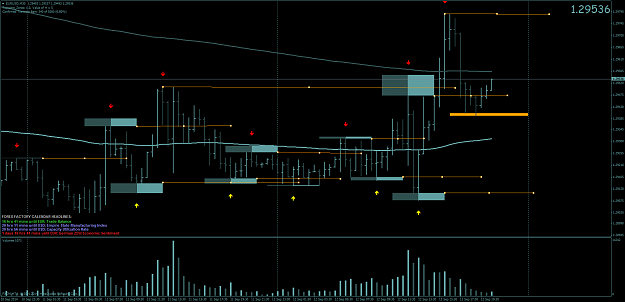
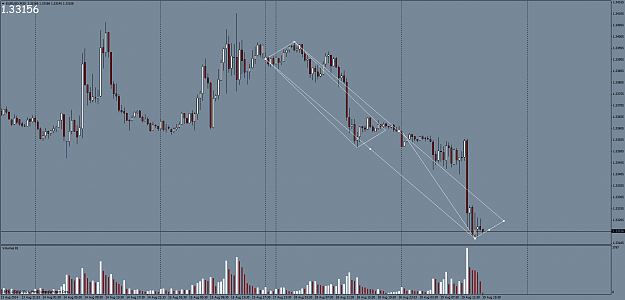
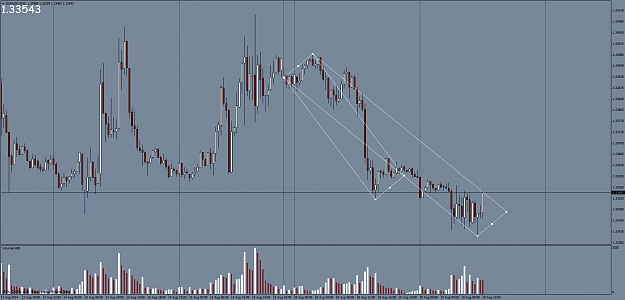
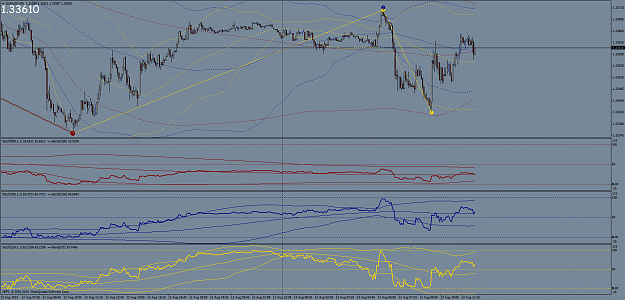
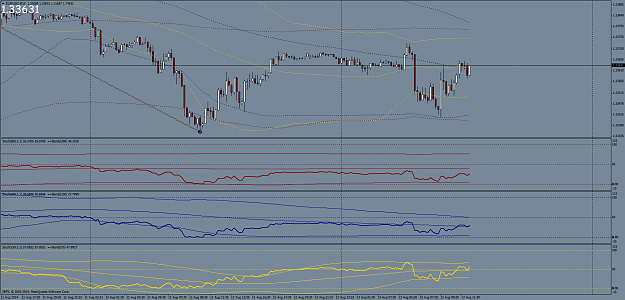
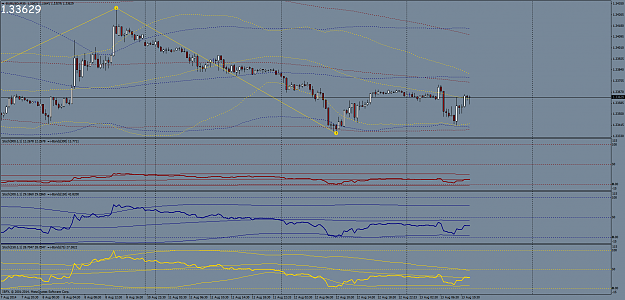
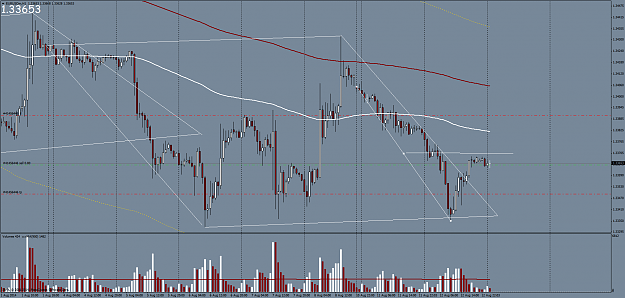
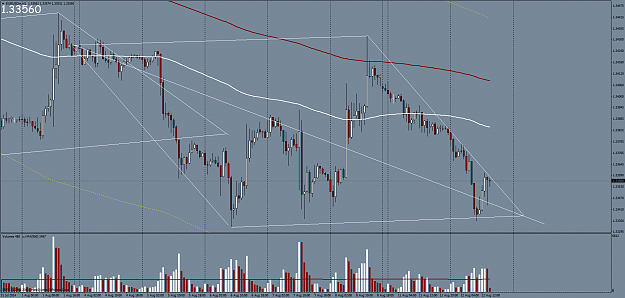
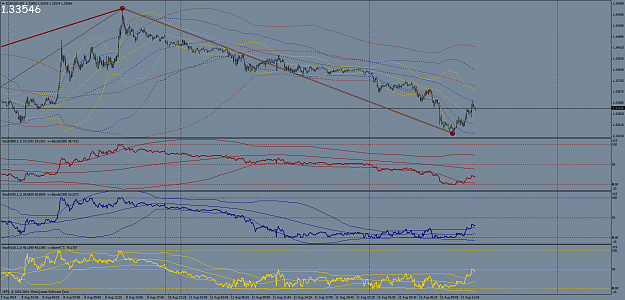
Looking for longs on a pullback to test the lows, may not go that far though. Here's what I see with my method. image image image Range is likely.
The similarity system
- Baillie replied Aug 11, 2014
Just closed trade based upon resistance and time of day, looking to get short after midnight here EST US. Here's pic of trade.
The similarity system
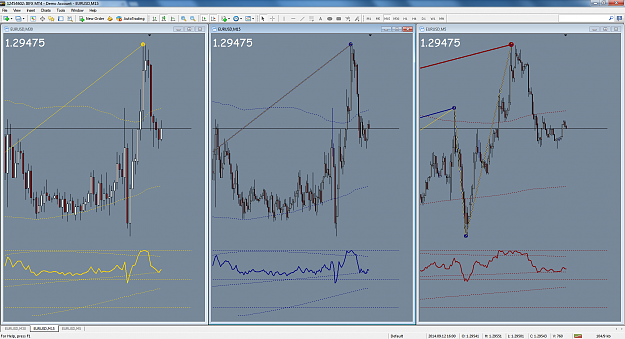
- Baillie replied Aug 11, 2014
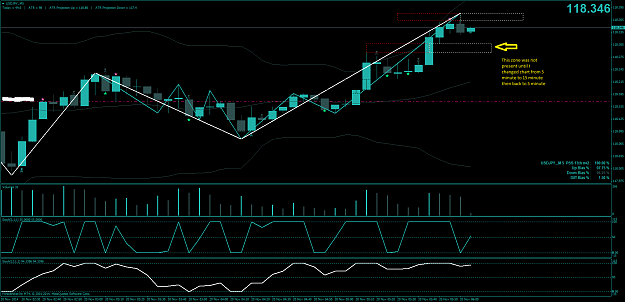
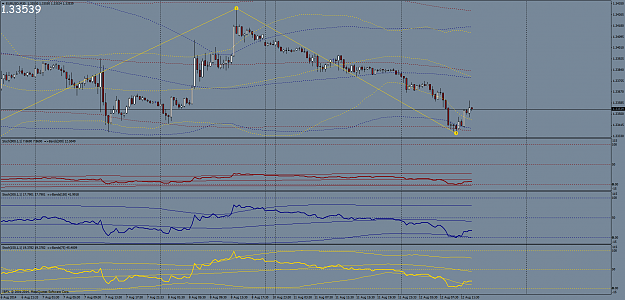
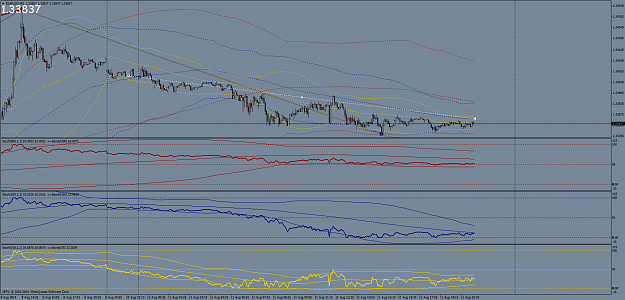
Here is another 3 pics of the 5, 15 and 30 min charts. As per my last post, Similarity occurs when you have a 3 level ZZ Semaphore on all 3 TF's. Keep that in mind. So according to the similarity principle we trade from dis-similarity to similarity. ...
The similarity system