- Search Energy EXCH
- 51 Results (2 Threads , 49 Replies )
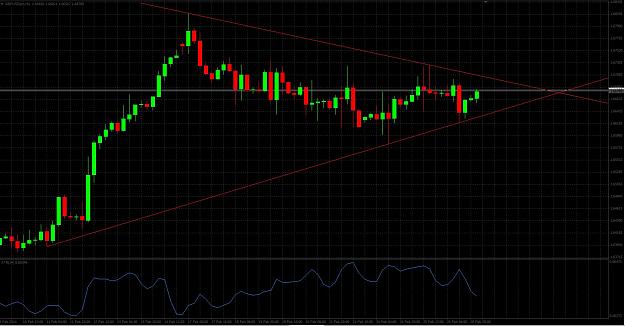
- Baggi replied Feb 26, 2014
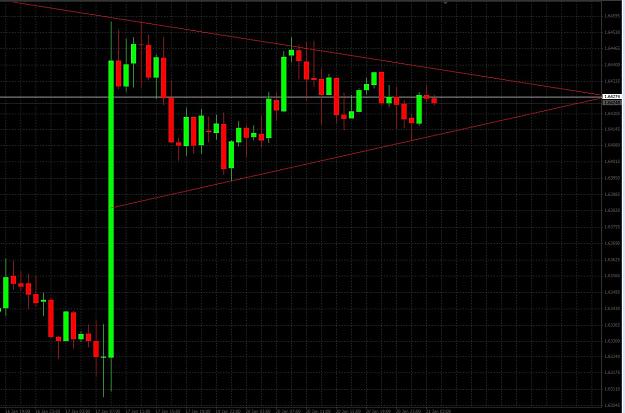
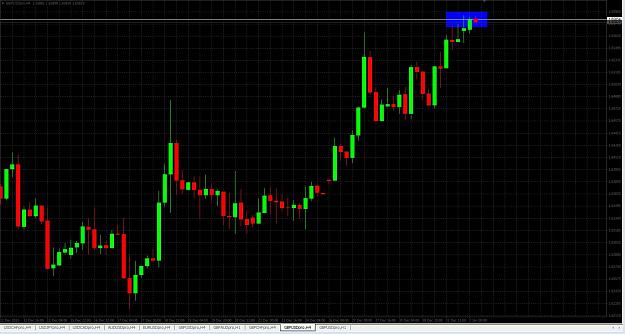
This is what I'm looking at on my four hour chart. image I'm starting to think that the longer we consolidate in this area, the more likely we will see another large move up.
Cable Update (GBPUSD)
- Baggi replied Feb 17, 2014
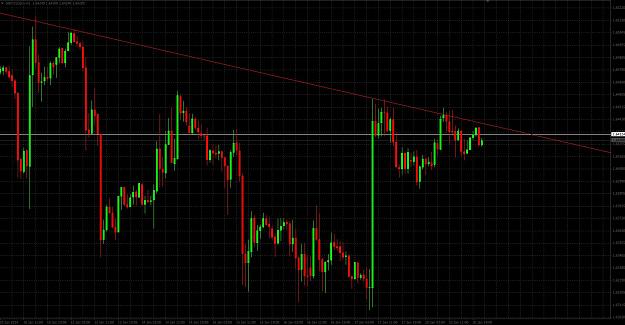
Jimmy, why don't you start your trendline back a bit further? This is what I'm talking about: image
Cable Update (GBPUSD)
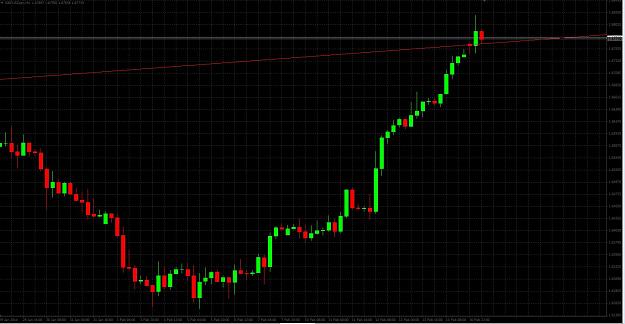
- Baggi replied Feb 17, 2014
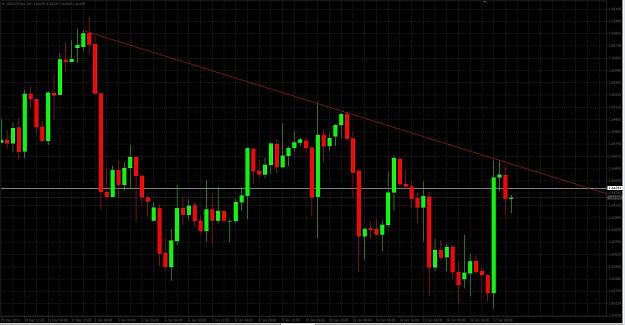
I drew the trend line about 8 hours ago, give or take. Look how it bounced right off the trend line. image
Cable Update (GBPUSD)
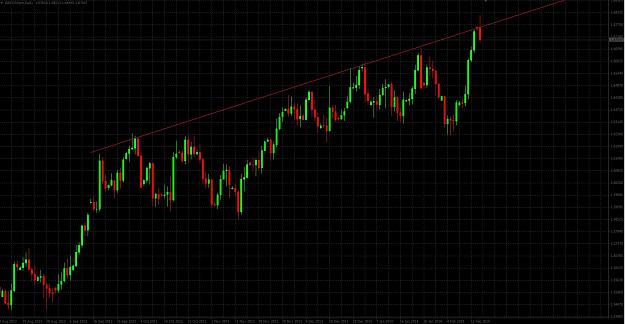
- Baggi replied Feb 3, 2014
This is what I'm looking at on the daily. image If this uptrend holds, I plan to make a lot of money. Otherwise, I plan to lose about 5% of my account getting stopped out.
GBP/USD and EUR/USD
- Baggi replied Feb 2, 2014
We are too close right now to the middle. This is what I'm looking at. image This is the 4 hour chart, and it looks like we have more downside. Until about 1.6370 or so.
Cable Update (GBPUSD)
- Baggi replied Jan 29, 2014
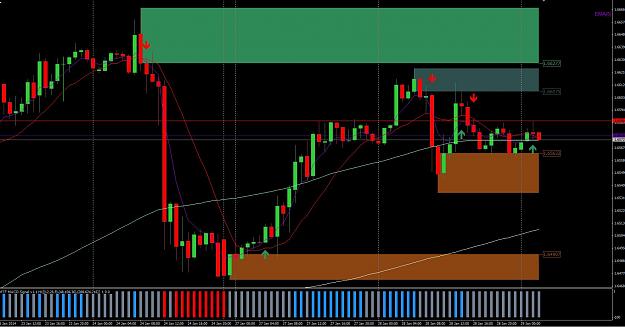
You mean something like this? image It must be the EMA Crossover thing. I'll search this website for something called, "EMA Crossover"
Cable Update (GBPUSD)
- Baggi replied Jan 28, 2014
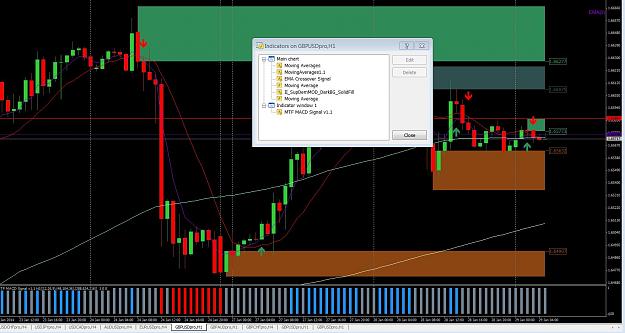
Here is my chart of GBP/USD. image I discovered something interesting about the arrows (red and green) tonight when I was looking back over the past few weeks. Does anyone know whose system this is? I don't remember where I got these red and green ...
Cable Update (GBPUSD)
- What system is this?Started Jan 28, 2014|Trading Discussion|14 replies
I can't remember where I obtained this from, but it paints an up or a down arrow depending on the ...

- Baggi replied Jan 21, 2014
And no more W pattern. Now we are breaking down. Good thing I got out of my long when I did. image I'm off to bed. I'll be interested in seeing where we end up after I awake tomorrow.
Cable Update (GBPUSD)
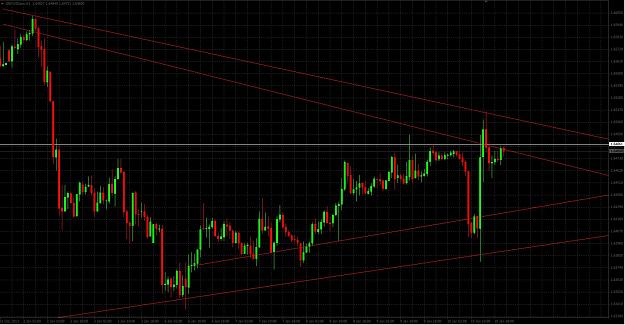
- Baggi replied Jan 20, 2014
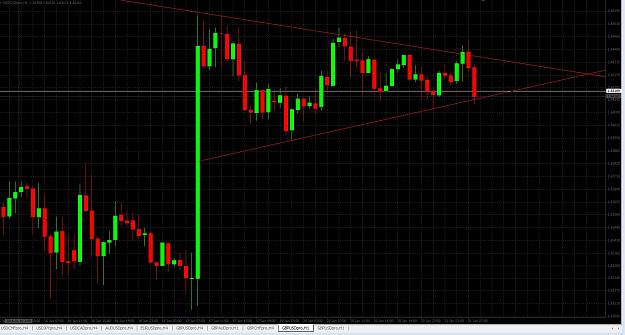
This is what I'm looking at right now. I still don't know where the bottom range is on this thing though. Missed a couple of good entries today. Still looking for a solid entry. image
Cable Update (GBPUSD)
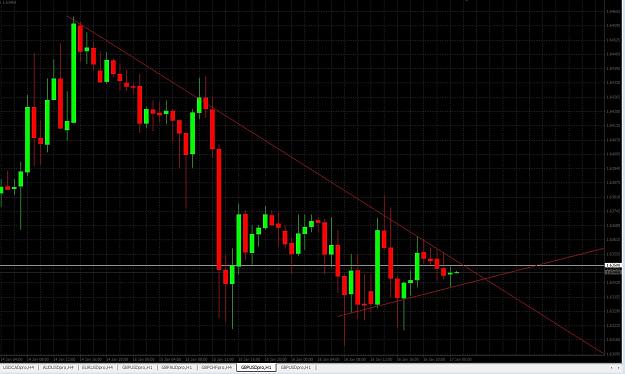
- Baggi replied Jan 17, 2014
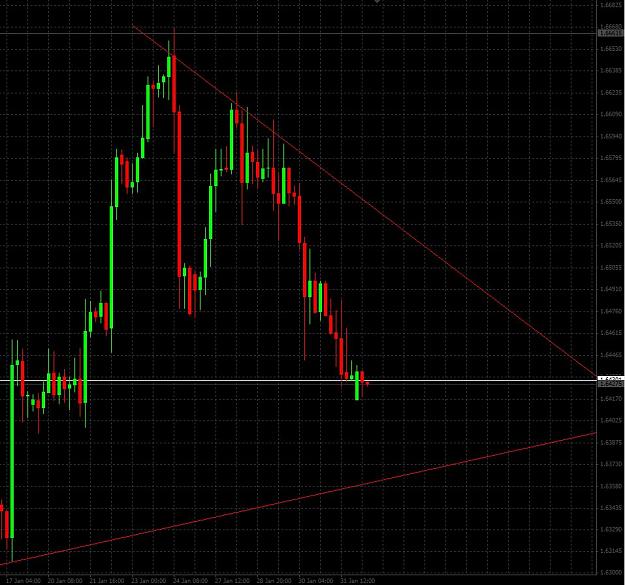
It looks like bulls were rejected on their way up. image It will be interesting to see what happens next week. I plan to take a short scalp if we hit that line again and see where that takes me. Ultimately though, I'm still bullish overall.
Cable Update (GBPUSD)
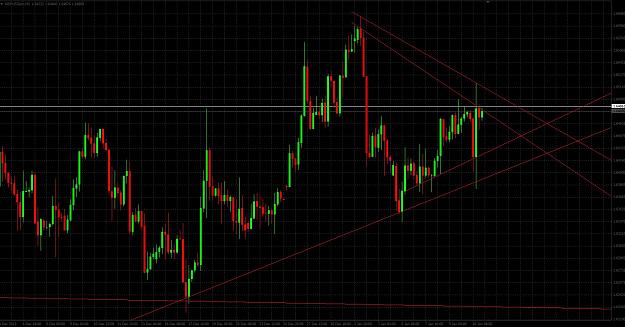
- Baggi replied Jan 16, 2014
This is what I'm watching right now in the short term. image I took a position earlier at 6354 before I did my due diligence and drew out my charts (Don't trade right after waking up). I'll sell for a loss if we but out of the bottom and hold ...
Cable Update (GBPUSD)
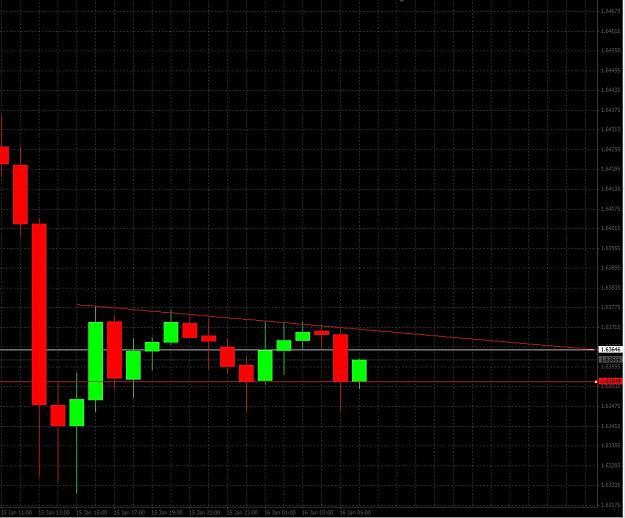
- Baggi replied Jan 16, 2014
This is what I'm looking at for the moment. image I still think we can get down to the 6220ish area, but I'm hoping this is the bottom here. If not, I'll not lose anything tonight as my stop was moved to buy entry.
Cable Update (GBPUSD)
- Baggi replied Jan 6, 2014
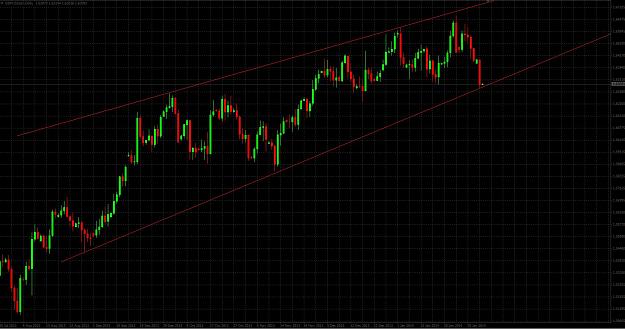
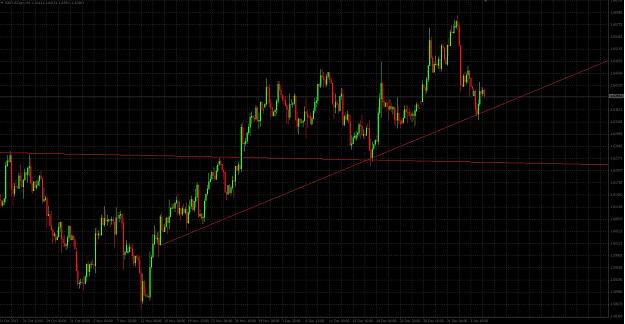
Ya'll are much too quiet! For what it's worth, this is the trend line I'm expecting. 4 hour chart. image
Cable Update (GBPUSD)
- Baggi replied Jan 3, 2014
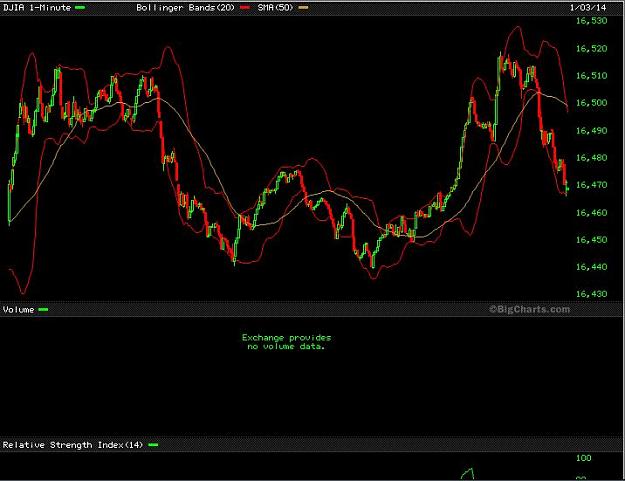
I was looking at the intraday of the DJIA. image Notice it shot up towards the end of the day? But when this was happening, GBP was headed down. True, we came back up in the last hour. But the market was turning down then.
Cable Update (GBPUSD)
- Baggi replied Jan 1, 2014
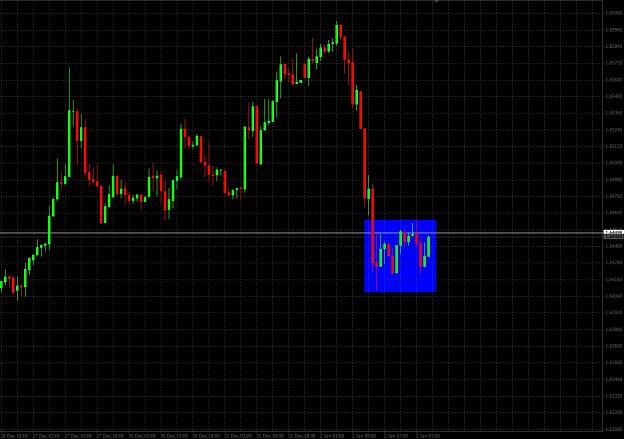
I took a short right now to balance my long and protect my profits. I may have jumped the gun here, but the rejection at this level, highlighted in blue, is giving me fits. image If we go up for a bit, I'll hang on to both positions for a bit to ...
Cable Update (GBPUSD)
- Baggi replied Jan 1, 2014
Still not answering the question I'm asking. No worries, I know it's my fault. Let me try asking another question, perhaps this will assist me in finding the answer I'm looking for. When will these trades start including USD pairs again? I haven't ...
EURUSD