- Search Energy EXCH
- 58 Results
-
 Arnoud replied Feb 6, 2018
I trade medium timeframes attempting to go with the trend.. so if I hold the trade for longer or scalp it depends on volatility and how far the trend has extended according to the strategy I trade. Yes I suppose that an effect of the problem is ...
How to manage your ego and stay humble?
- Arnoud replied Oct 10, 2017
Been a while.. small update .. retest trendline might reload if it does image
Chart dump
- Arnoud replied Aug 22, 2017
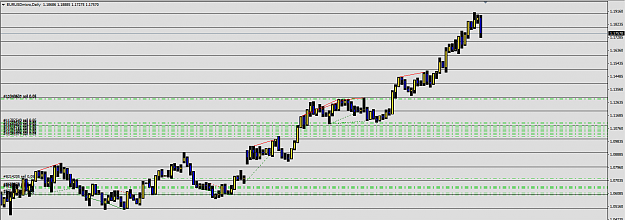
things can go lower taking out the marked area but i do not care image
Chart dump
- Arnoud replied Aug 21, 2017
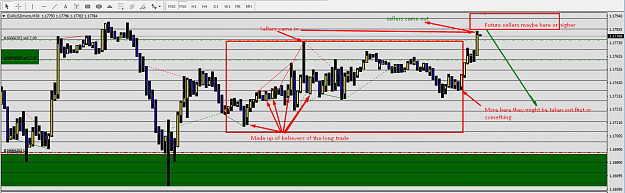
some deeper analysis of this .. would not take this to seriously though as it is quite unsure where the majority of sellers will jump in image
Chart dump
- Arnoud replied Aug 21, 2017
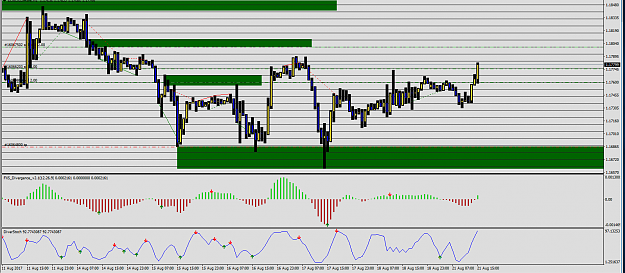
SELLING SOME GOT Some limits higher up but thats not important ... what i do like is this chart i made image
Chart dump
- Arnoud replied Aug 4, 2017
Ok, I linked an account I have been working on for quite a while now.. It started out as a market making strategy based on limit orders using clusters of smaller trades to be able to handle a bigger fail margin but later turned towards an at market ...
Chart dump
- Arnoud replied Aug 3, 2017
Re-did the whole thing.. might link my eurusd account in the near future to this thread for the purpose of busting it image
Chart dump
- Arnoud replied Jul 26, 2017
I expected this to be broken as it is already broken at another broker ... but even so here goes image
Chart dump
- Arnoud replied Jul 15, 2017
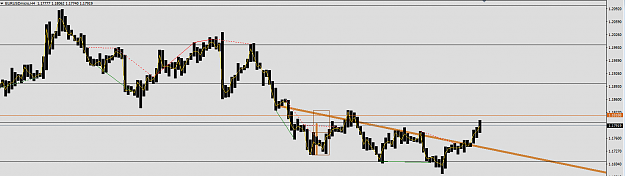
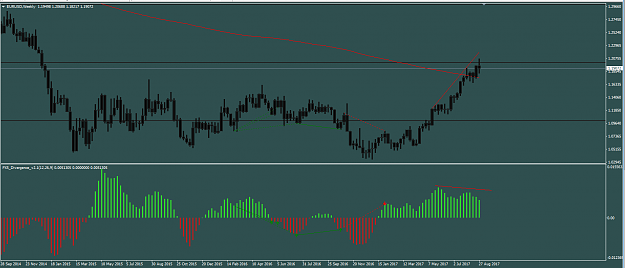
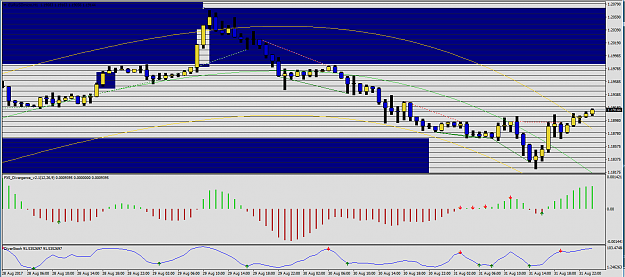
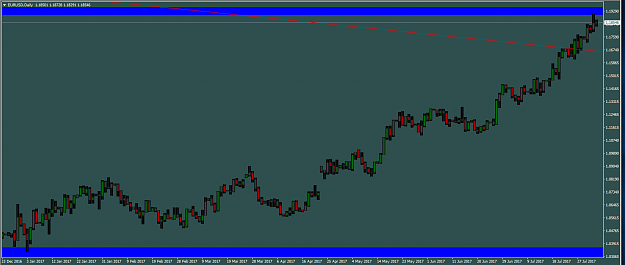
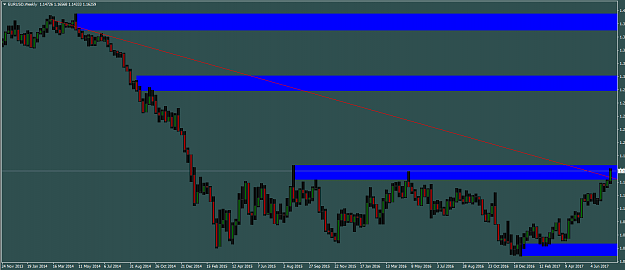
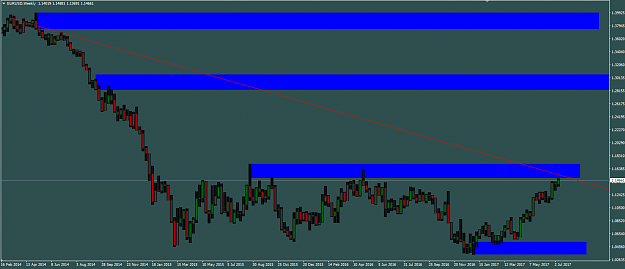
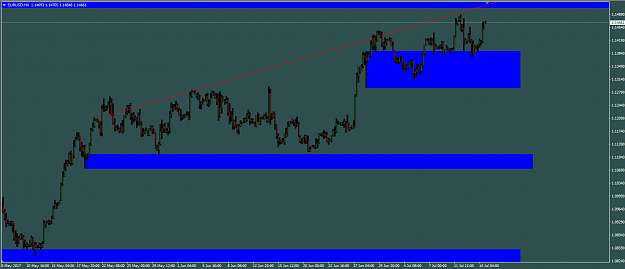
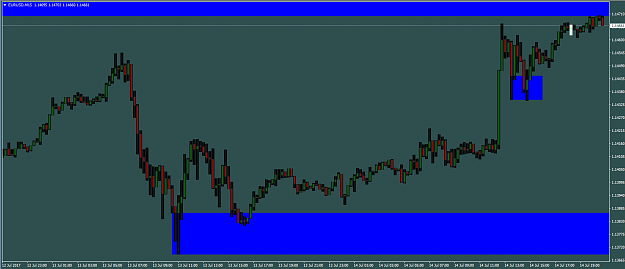
First chart for the dump : EUR/USD Weekly 4 Boxes with 1 trendline .... The trendline might be a little too "Custom" to work.. image Followed by an 4 Hour chart of the EUR/USD pretty zoomed out and another "Custom" trendline. image Finishing ...
Chart dump
- Arnoud replied Jun 7, 2017
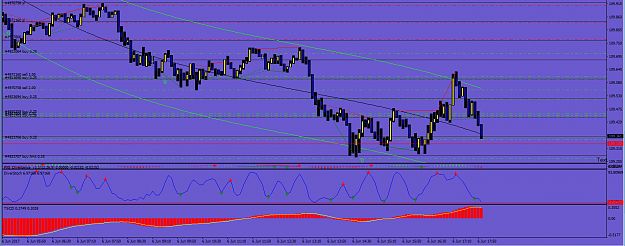
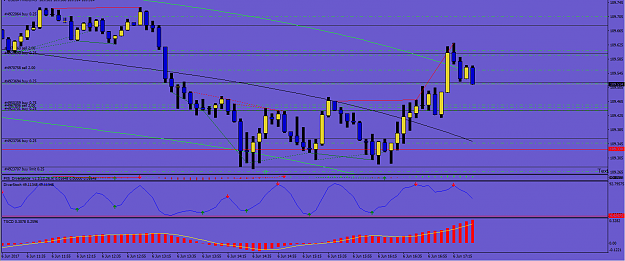
Considering selling there (ish) how about you ? ............................... For me on this strategy as long as the bottom channel line does not touch price I will consider it a sell image USD/JPY - H11
USD/JPY Discussion
- Arnoud replied Jun 6, 2017
Praying worked.. This time image Succes for me
USD/JPY Discussion Closed 2/3 leaving 1/3 @ break even
- Arnoud replied Jun 6, 2017
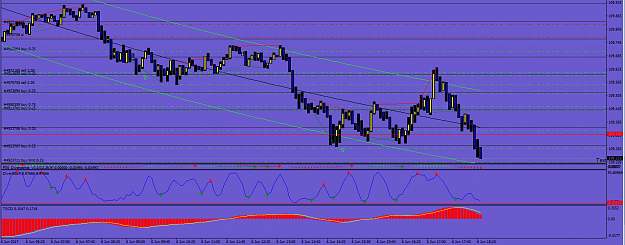
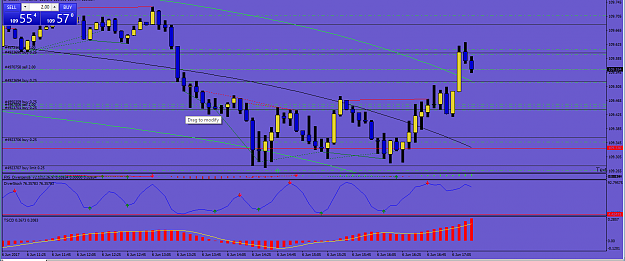
See it changing & this image shows the next bear divergence ? image
USD/JPY Discussion
- Arnoud replied Jun 6, 2017
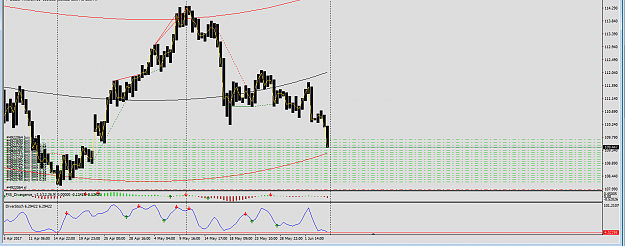
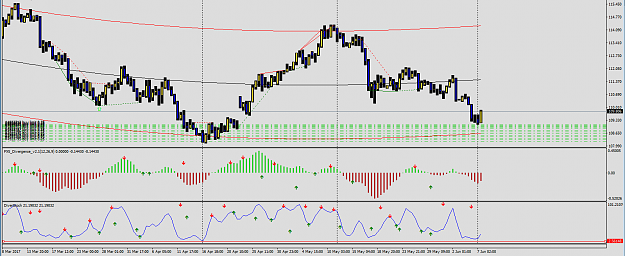
Not a big fan of using many indicators but right now I need to test the combination of some factors on chart that include these indicators .. just interpretting the channel boundries as overbought and oversold including 2 forms of divergence image ...
USD/JPY Discussion
- Arnoud replied Jun 6, 2017
trying short toward there on my gamble test account image
USD/JPY Discussion
- Arnoud replied Jun 6, 2017
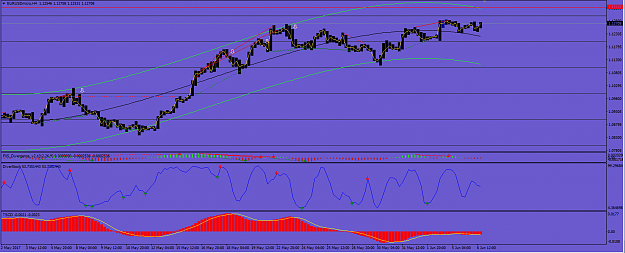
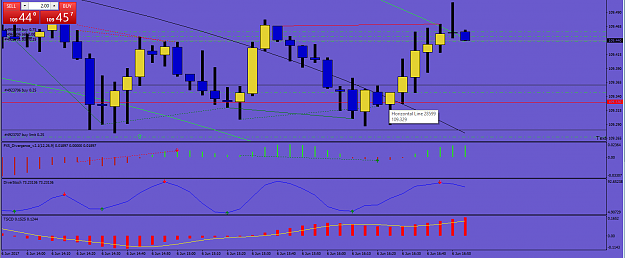
Is there a potential divergence playing out on your chart aswell ? got an H11 chart here that shows a possible divergence coming up but not specialized in it so might aswell ask you if your chart is starting to give strange beeping sounds .. either ...
USD/JPY Discussion