- Search Energy EXCH
- 35 Results
-
 ArbitragAcid replied Oct 25, 2019
image This is now the 41st time EURUSD has crossed the 4HR48MA (basically a 1HR200MA) by at least 20 pips this year. In the previous 40 times, 67.5% of those crosses extended away from the 4HR48MA by 60 pips or more. It could thus be said that it ...
EURUSD only
- ArbitragAcid replied Oct 24, 2019
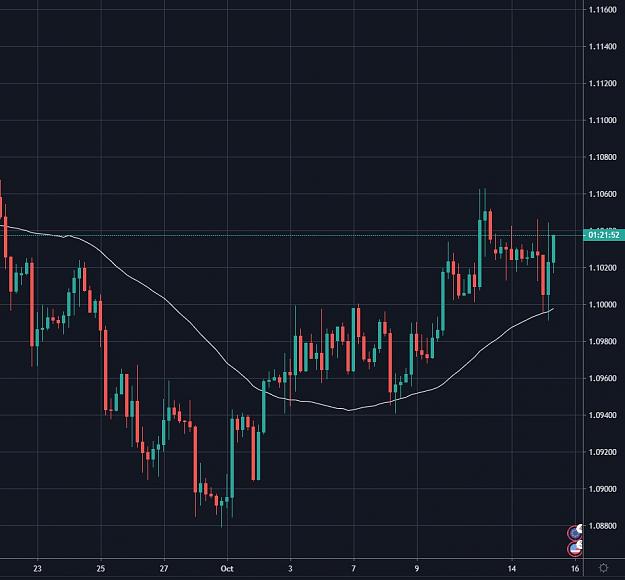
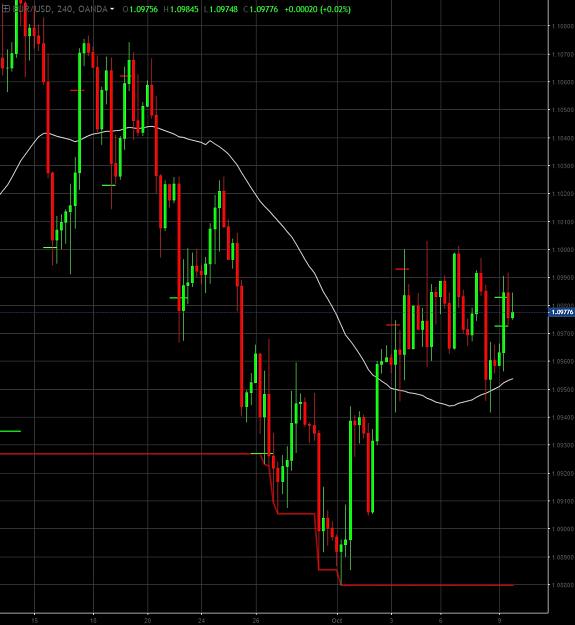
image Now we have the first time EURUSD has stricken the 4HR48MA since the 15th of October. If a 4HR candle can close below the 4HR48MA it will be the first time since the 2nd of October. Perhaps then we can have a downward swing over the coming ...
EURUSD only
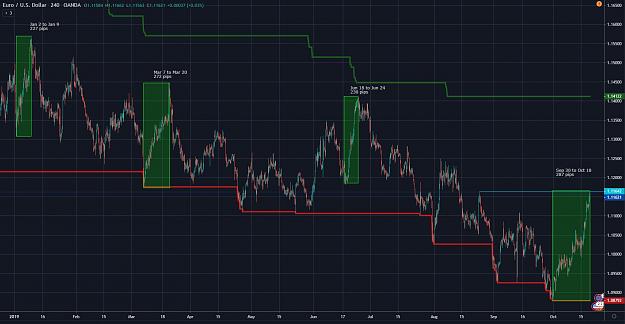
- ArbitragAcid replied Oct 18, 2019
BIGGEST BOUNCE IN 2019 With more than an hour to go in this Friday session we have clocked the biggest bounce this year for EURUSD at 287 pips. image Not only has this bounce outstripped the January, March, and June bounces which were the biggest ...
EURUSD only
- ArbitragAcid replied Oct 17, 2019
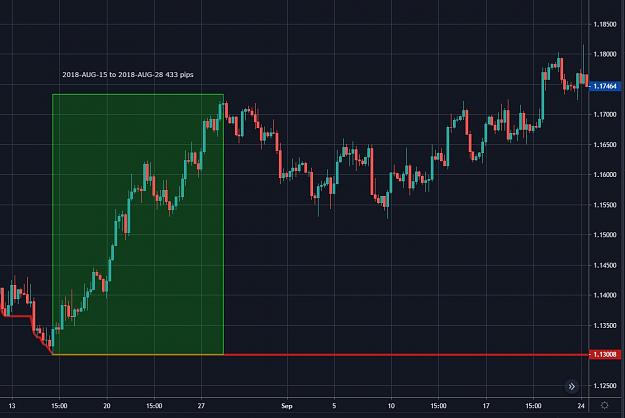
Since the beginning of 2016, the most significant diversion from the 4HR48MA in EURUSD was June 23rd, 2016 which was the day of the brexit referendum. On that day, the pair rose 74 pips, dove 516 pips, and recovered 278 pips only to go into a range ...
EURUSD only
- ArbitragAcid replied Oct 17, 2019
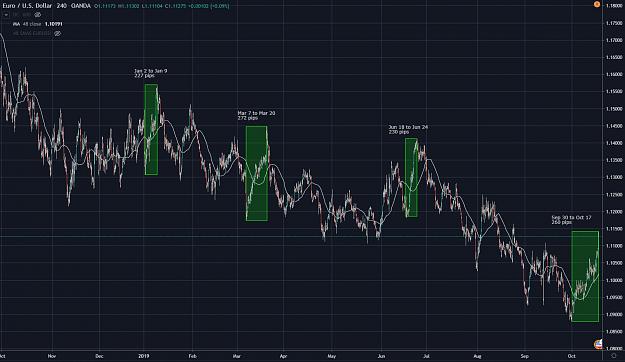
This is now a 260 pip bounce. image The tallest bounce this year was from March 7, 2019 to March 20, 2019 wherein EURUSD bounced trough to peak 272 pips. The second tallest was in June at 230 pips and the third was in January at 227 pips. This ...
EURUSD only
- ArbitragAcid replied Oct 15, 2019
image "Two! Two bounces off the 4HR48MA! HaHaHa!" image It can't bounce forever....... ..eventually it will have to cross below.
EURUSD

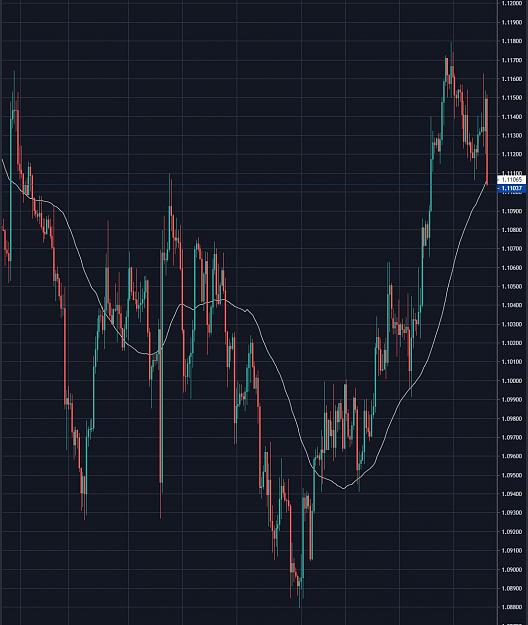
- ArbitragAcid replied Oct 11, 2019
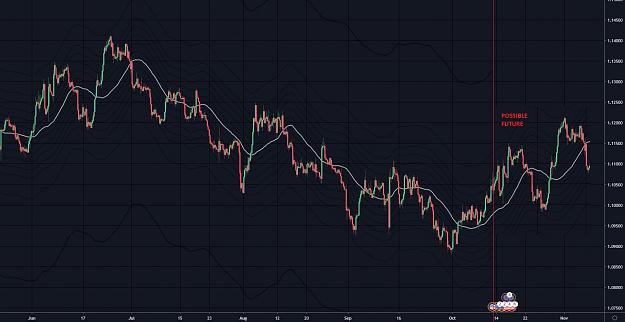
image In June (2019) we had a period that saw highs not seen since March after fairly consistent lower highs and lows from January to the end of May. Since July we have seen consistent lower highs and lows until the recent September 30 low of ...
EURUSD only
- ArbitragAcid replied Oct 11, 2019
image Oh boy! So we broke through 80 pips above the 4HR48MA. And now can we get to 100 pips?!?! In the last twelve months we have seen diversion as much as 100 pips above the 4HR48MA only eight times. Currently that level is 1.1076. You know I ...
EURUSD only
- ArbitragAcid replied Oct 10, 2019
Dude is low-key bro. image
has anyone EVER seen a successful trader/trading system?

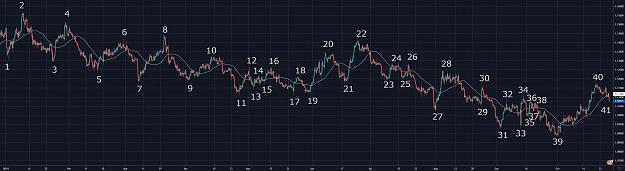
- ArbitragAcid replied Oct 10, 2019
image THIRTEEN Maybe fourteen or even fifteen The number of times EURUSD has risen above the 48MAon4HR by 80 pips in the last year. Around once a month we have had that sort of diversion. In all cases shorting there would have been profitable for ...
EURUSD only
- ArbitragAcid replied Oct 10, 2019
Bumpity bump bump bam!
EURUSD only And now we have broken through the 1.1000! I can finally get some advantageous shorts on. I added shorts at 1.1015 with an accumulative position short from 1.1011 and limit orders to get more short at 1.1035 & 1.1055. ...

- ArbitragAcid replied Oct 9, 2019
Some traders want UP Some teaders want DOWN I want UP AND DOWN image
EURUSD
- ArbitragAcid replied Oct 9, 2019
After EURUSD remained below 1.0970 for eight hours I moved my stops on my bigger short pieces in one account to 1.09892 and to 1.09724 in the other account only to see both of them get taken out on this latest bounce. A tiny profit (virtually break ...
EURUSD only
- ArbitragAcid replied Oct 8, 2019
Still holding short from 1.0973 and 1.0993 with a total position short at 1.09876. Looking for that 1.0929 target 20 pips below the 8dayMA. image
EURUSD only

- ArbitragAcid replied Oct 7, 2019
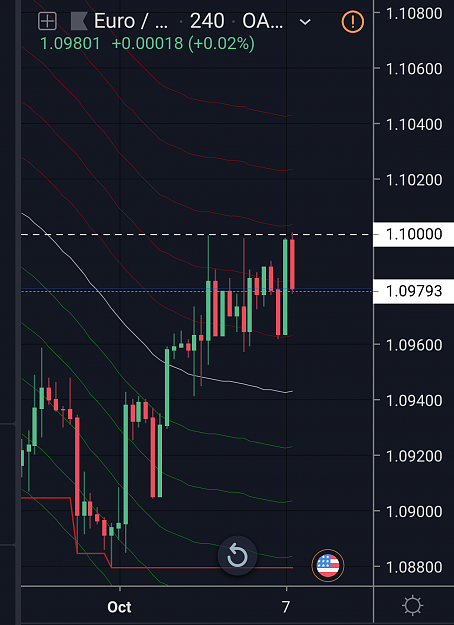
One of the famous Donchian rules: "Watch for crawling along or repeated bumping of minor or major trend lines and prepare to see such trend lines broken." image We have three bumps against the 1.1000 level since the third and with each bump the ...
EURUSD only

- ArbitragAcid replied Oct 4, 2019
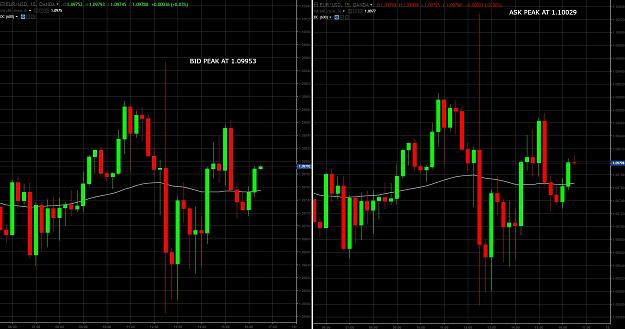
I understand that many choose to trade EURUSD precisely because the spread is smaller and more reliable compared to other pairs. But this is not to say that the spread NEVER goes above some particular level. Before you look at a chart and say: ...
EURUSD only
- ArbitragAcid replied Oct 4, 2019
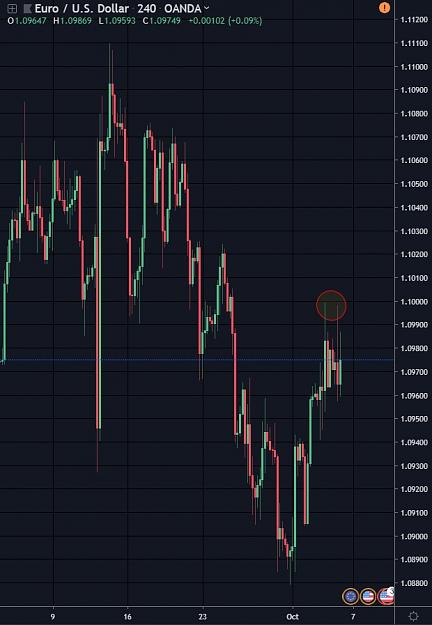
Yeah two unsuccessful stabs at the 1.1000 level in the last 24 hours. Very likely we will have to wait until next week to see it taken out. But you never know.... image
EURUSD only
- ArbitragAcid replied Oct 3, 2019
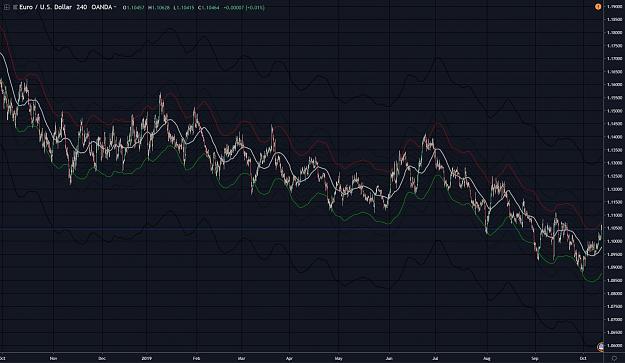
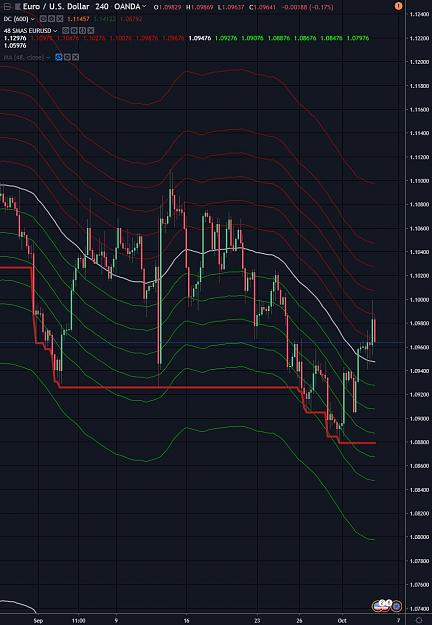
Oh I don't actually use any labels. I only added them to that image so you can tell what those lines represent. image My chart is simply clean like this. You can see the values of each of the lines in the legend (1.12976, 1.0976, 1.10476, etc.) ...
EURUSD only
- ArbitragAcid replied Oct 3, 2019
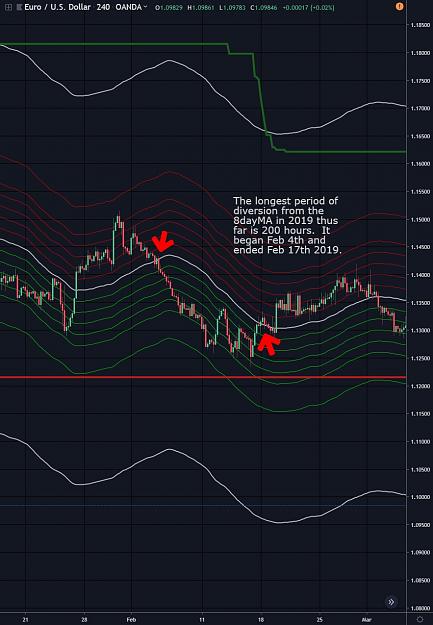
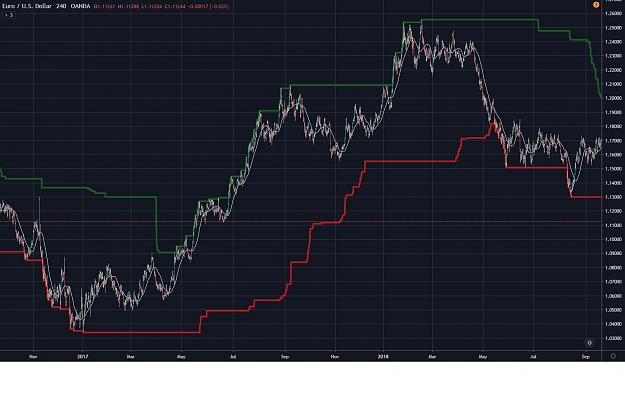
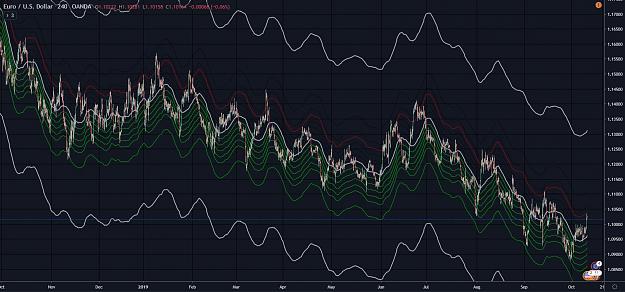
I only mentioned the length of the recent diversion so as to point out that it was getting long in the tooth and we should expect a bounce any time. As we can see it failed to break the February record. image That said, the February period was ...
EURUSD only