- Search Energy EXCH
- 15 Results (2 Threads , 13 Replies )
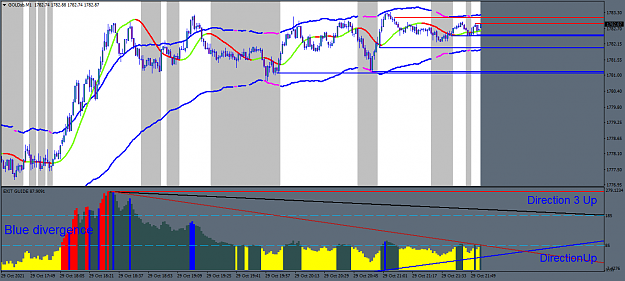
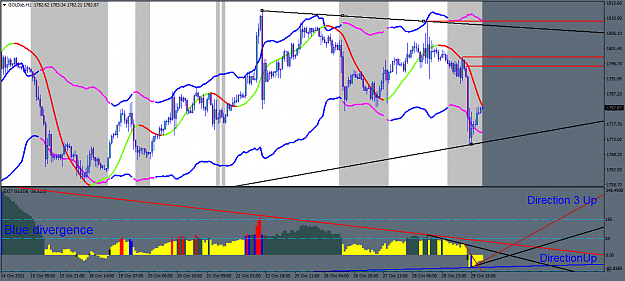
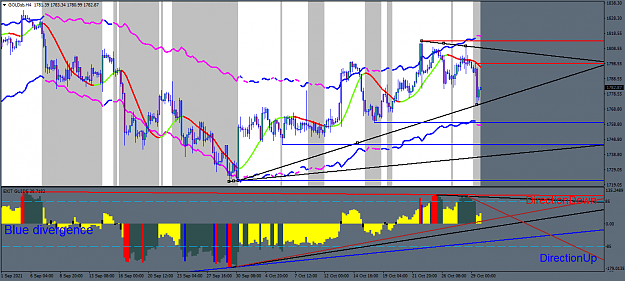
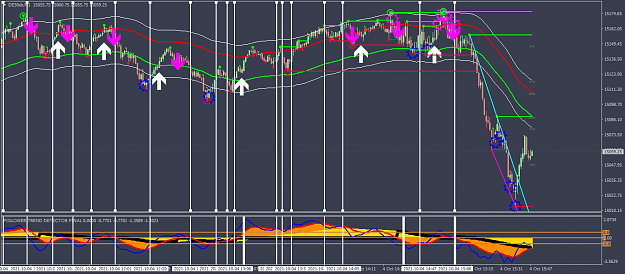
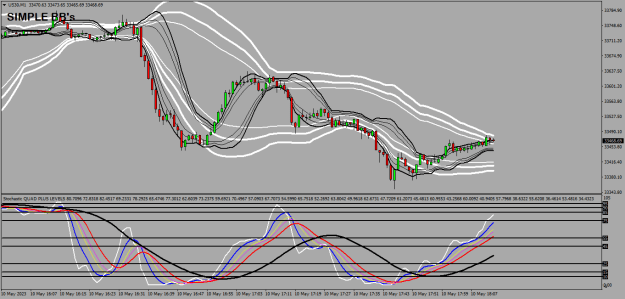
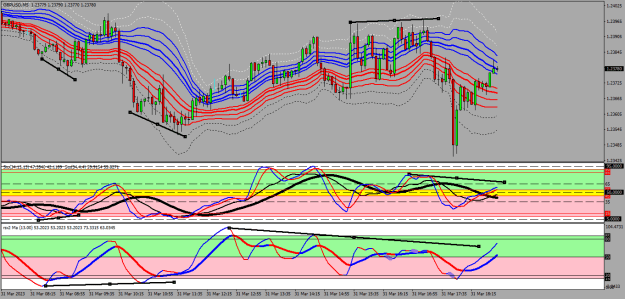
- Easy mt4 trading templatesStarted May 10, 2023|Platform Tech|8 replies
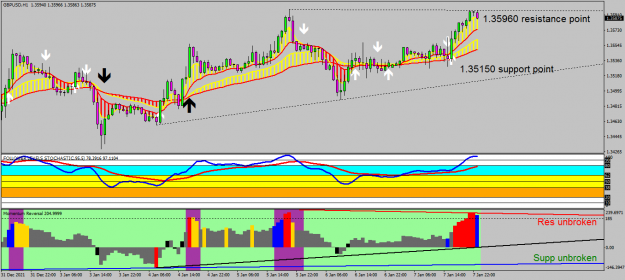
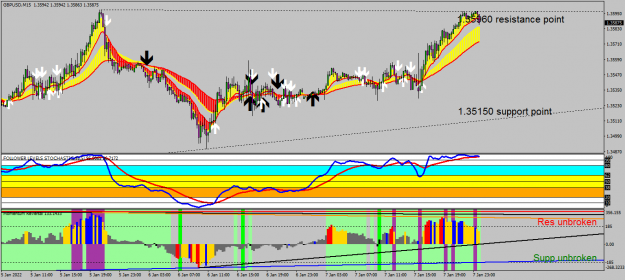
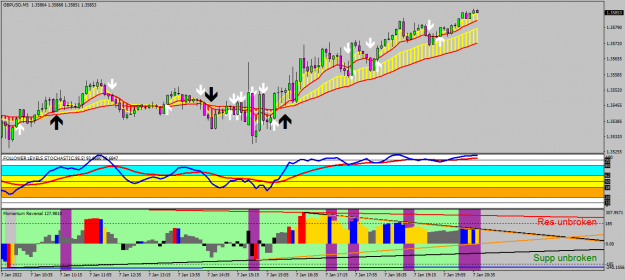
I thought this would be a great set up for BB followers - the trending being easier to recognise as ...

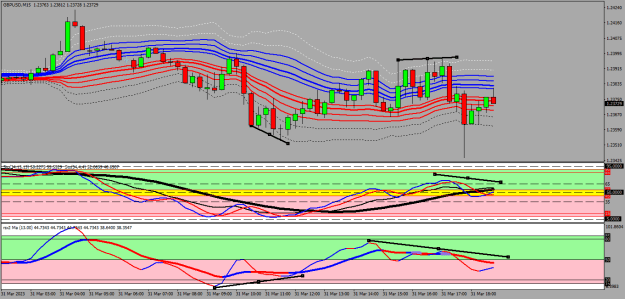
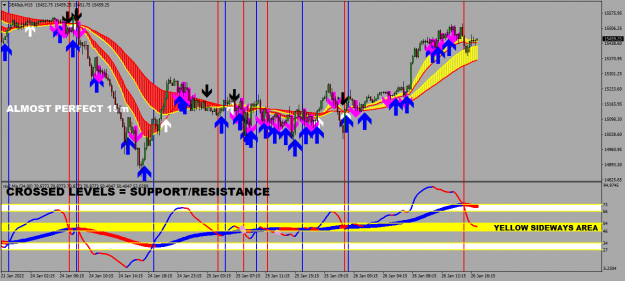
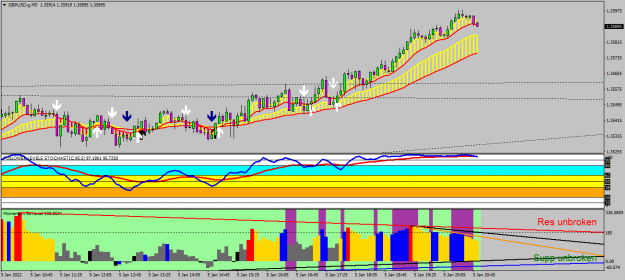
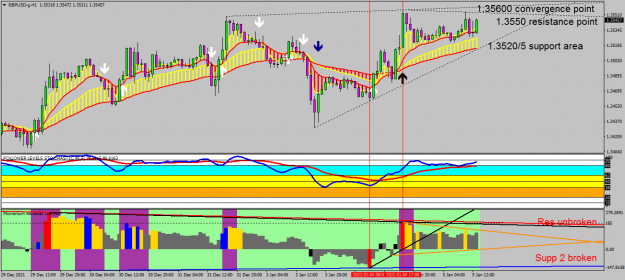
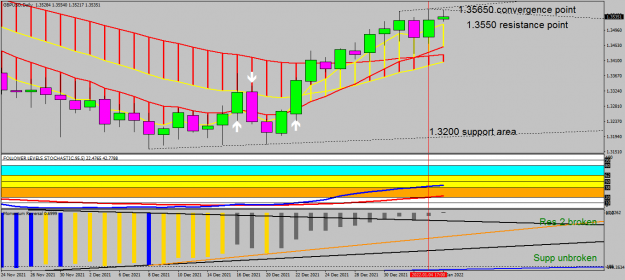
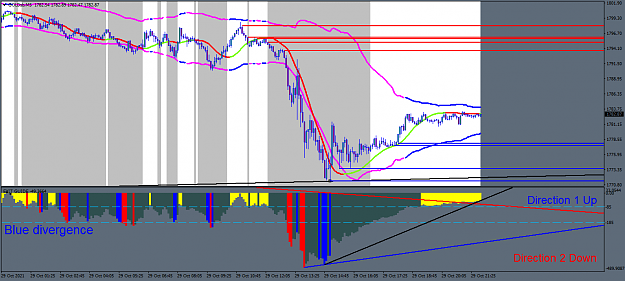
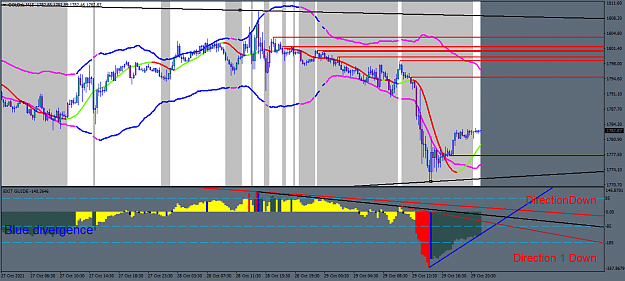
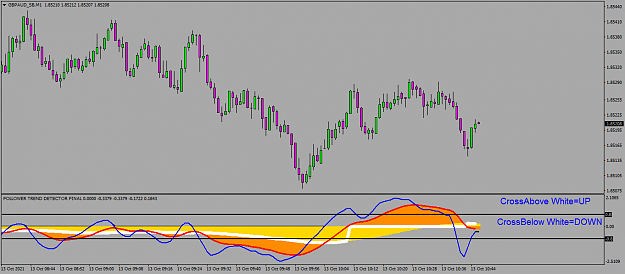
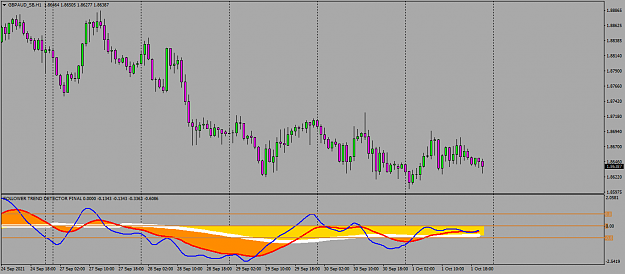
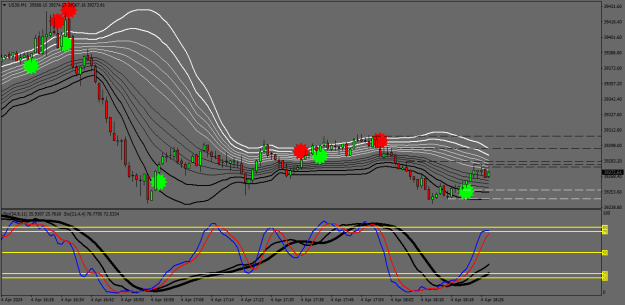
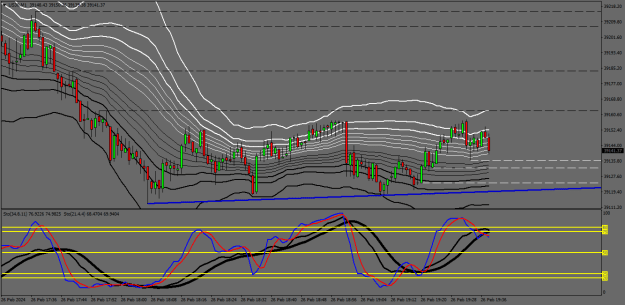
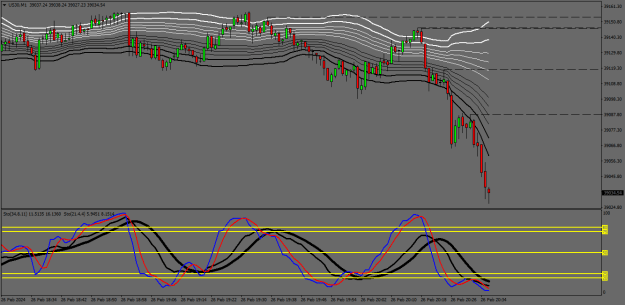
- 15m chart templateStarted Jan 26, 2022|Platform Tech|19 replies
This is a specific template for 15m charts but can be adjusted to fit timeframes up to 1 hour by ...