- Search Energy EXCH
- 27 Results
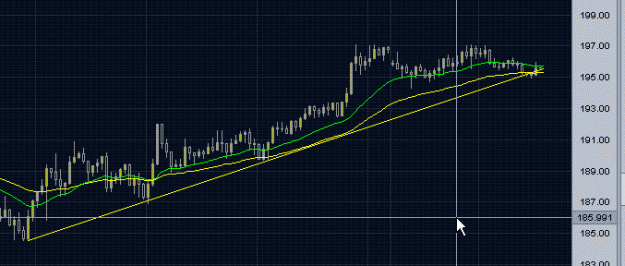
-
 worlhin replied Dec 10, 2008
this is wat i see... If this 1-2-3 is valid, then 1st target is 135.5, 2nd target 133.2
Auslanco - GBP/JPY and GBP/USD (newstrade)

- worlhin replied Oct 27, 2008
50 EMA (orange line) seems to be a strong support at 5 min chart for now...
Auslanco - GBP/JPY and GBP/USD (newstrade)

- worlhin replied Oct 27, 2008
I have some long position aiming at 61.8% retracement of today down move... TP at 146...
Auslanco - GBP/JPY and GBP/USD (newstrade)

- worlhin replied Oct 24, 2008
GJ 1h chart, once 149.4 hit, i out of market to sleep... just 30 pips a trade, 2 trade per day is enough for me... Though today i get more than 2 trades each trade is mor than 30 pips... ha ha ha... P.S i still trading o.1-0.2 micro lots... learner ...
Auslanco - GBP/JPY and GBP/USD (newstrade)

- worlhin replied Oct 13, 2008
Strong resistance observed at 175.5, has been tested 5 times at GJ 1h chart...
Auslanco - GBP/JPY and GBP/USD (newstrade)

- worlhin replied Sep 23, 2008
I see support on 1h GJ chart
Auslanco - GBP/JPY and GBP/USD (newstrade)
- worlhin replied Sep 22, 2008
15 min gj chart, might not be dependable. just for reference...
Auslanco - GBP/JPY and GBP/USD (newstrade)

- worlhin replied Sep 22, 2008
Continue of my GJ 1h chart... is it going up again or go down now? i think going down... not sure...
Auslanco - GBP/JPY and GBP/USD (newstrade)

- worlhin replied Sep 21, 2008
K, thanks... now i can draw my trendline. The line was moved a little bit when i extend it... but should be abt the same....
Auslanco - GBP/JPY and GBP/USD (newstrade)

- worlhin replied Sep 21, 2008
The chart was submitted on 19 sep... if anyone notice, we are a the bottom of purple channel when it hit 194.3x. though i short as i "feel" there is strong down movement, i'm afraid I'm long... oops i means "wrong"... Btw, anyone can teach me how to ...
Auslanco - GBP/JPY and GBP/USD (newstrade)

- worlhin replied Sep 19, 2008
some pattern observed on gj 1h chart... I draw the line since morning abt 14 hr ago, but was rushing to work so never really think about it... Partly bcos i was married to short...
Auslanco - GBP/JPY and GBP/USD (newstrade)

- worlhin replied Sep 18, 2008
trendline remain, with bias of breaking to downside. Something observed on 15 min chart after 2hr... been scalping GJ 5-6 times for 50-60 pips each, but all on demo account
Auslanco - GBP/JPY and GBP/USD (newstrade) Got to sleep... good night...

- worlhin replied Sep 18, 2008
Some pattern observed on GJ 1h chart...
Auslanco - GBP/JPY and GBP/USD (newstrade)

- worlhin replied Sep 17, 2008
some pattern observed on GJ 1h chart
Auslanco - GBP/JPY and GBP/USD (newstrade)

- worlhin replied Sep 17, 2008
Just set back to 10 then...
Auslanco - GBP/JPY and GBP/USD (newstrade) Aft that you will see that candle is above gann and qqe is crossed up. If it is really true that the H&S is forming then we might hit 195.

- worlhin replied Sep 17, 2008
I dunno why, but on my 4h chart, candle is above gann. I using vt trader as reference as my live account do not have gann and qqe.
Auslanco - GBP/JPY and GBP/USD (newstrade)

- worlhin replied Sep 17, 2008
did a see a flag on 1h chart?
Auslanco - GBP/JPY and GBP/USD (newstrade)

- worlhin replied Sep 17, 2008
Will the uptrend continue? below are observed in 1h chart
Auslanco - GBP/JPY and GBP/USD (newstrade)

- worlhin replied Sep 12, 2008
I didnt as i was wondering why my setting seems to be different from others. I set my gann at 5 and my qqe as below, anything wrong with the setting? Please kindly point it out thanks...
Auslanco - GBP/JPY and GBP/USD (newstrade)

- worlhin replied Sep 12, 2008
The picture is my settings... the candle is below both 5sma and gann
Auslanco - GBP/JPY and GBP/USD (newstrade) Another strange thing is i notice my 4h qqe is always on uptrend since 7 sep... confused... confused...
