- Search Energy EXCH
- 22 Results
- stradikus replied May 29, 2024
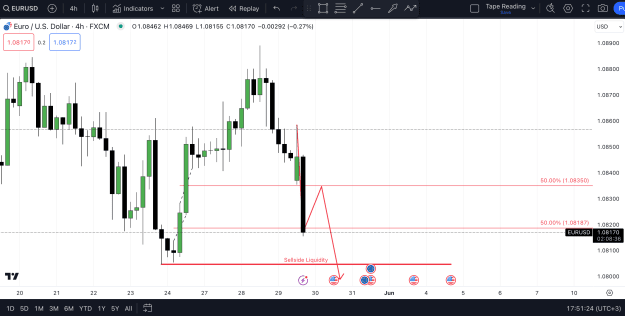
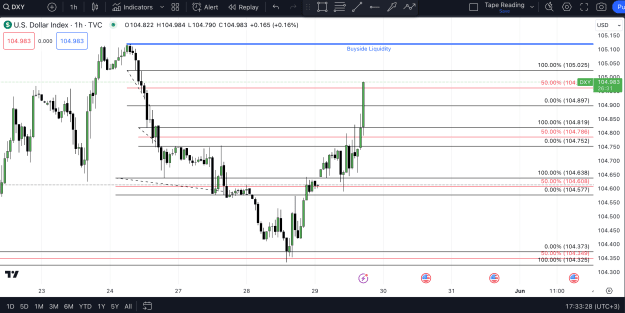
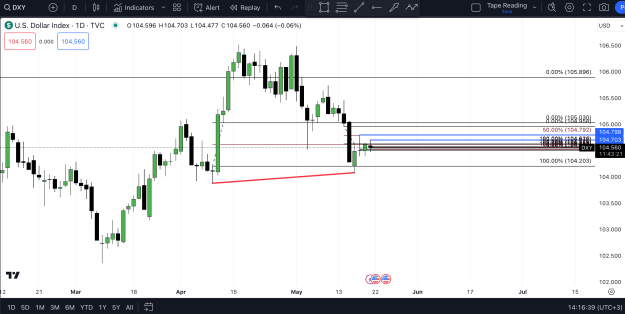
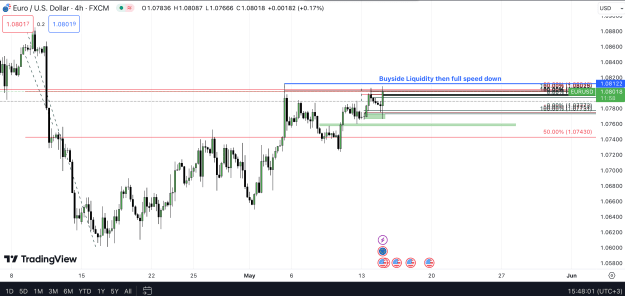
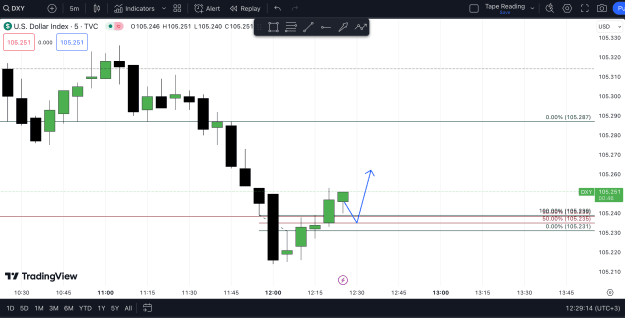
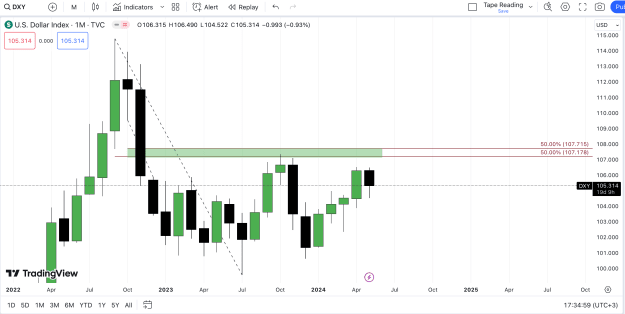
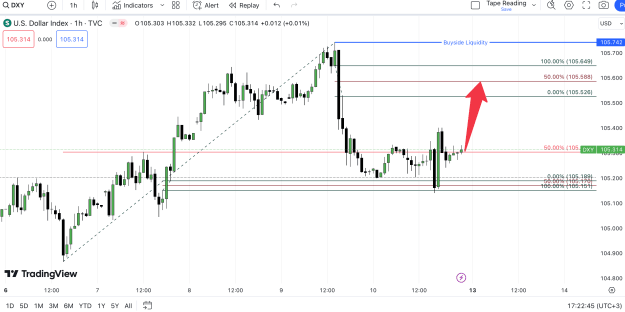
We're having a great run on the US dollar index towards the buyside liquidity. image (red lines are 50% price insufficiencies on the 4H chart)
EURUSD only
- stradikus replied May 29, 2024
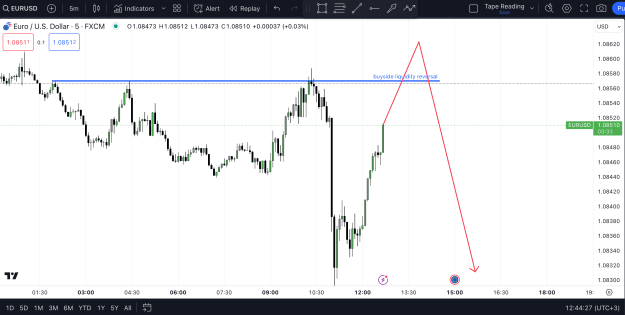
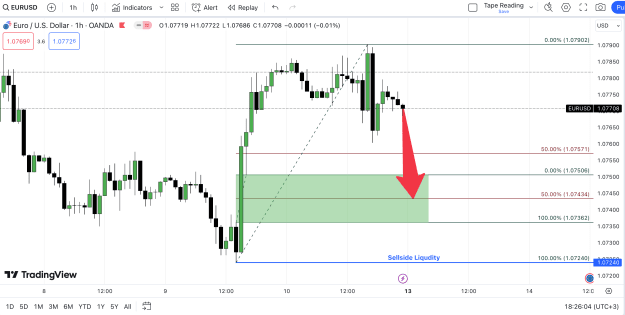
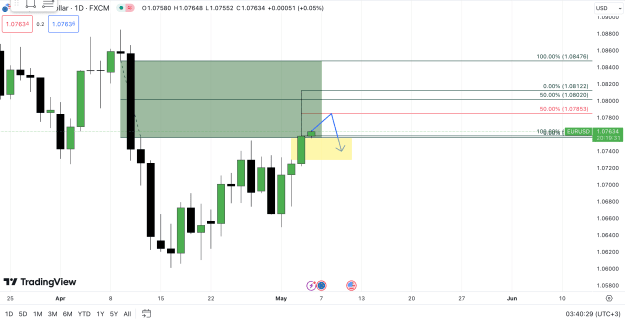
I'd like to see some retracement back to the .086 level then price failing hard. image
EURUSD only
- stradikus replied May 29, 2024
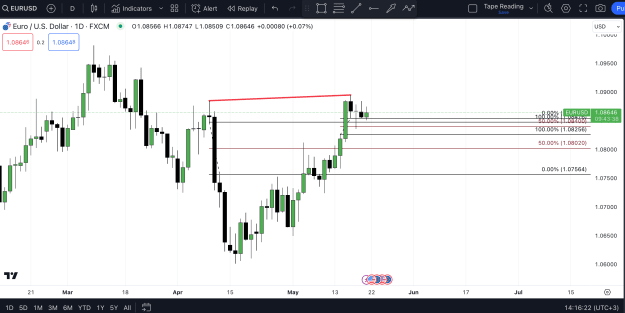
What I'd like to see happening is price retracing back to the 1.086 level then falling hard. image
EURUSD Only

- stradikus replied May 29, 2024
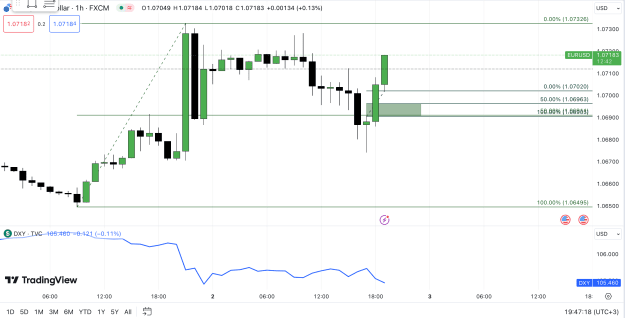
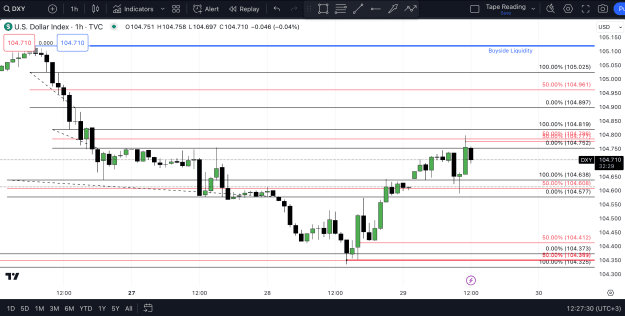
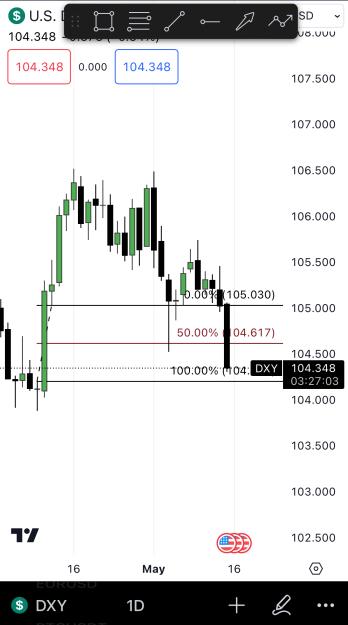
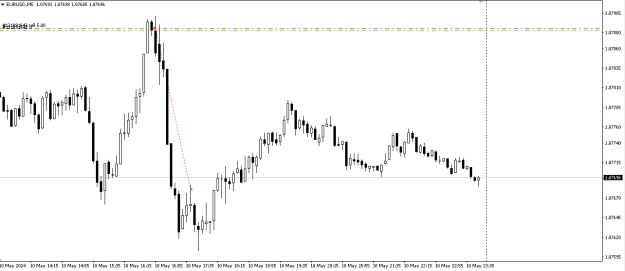
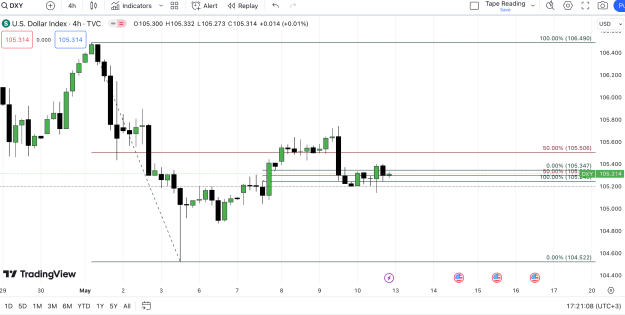
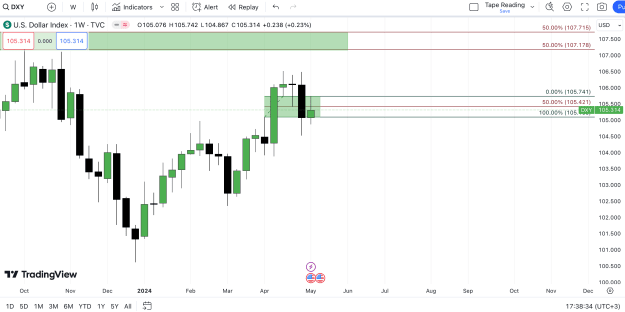
The Dollar Index very good hit the FVG(4H) on the way up then we experience a retracement down to the previous FVG(4H). I want to see it retracing back into the 50% of that FVG and continuing up. image On the contrary I have bought this move on ...
Only EURUSD
- stradikus replied May 27, 2024
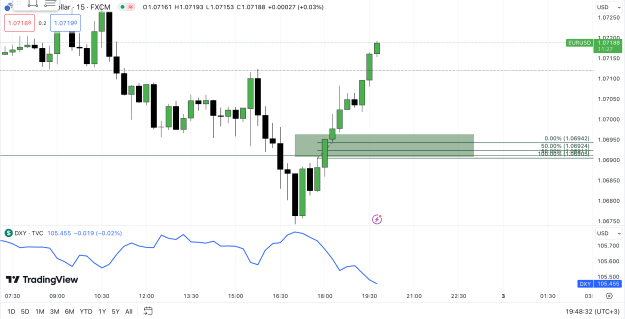
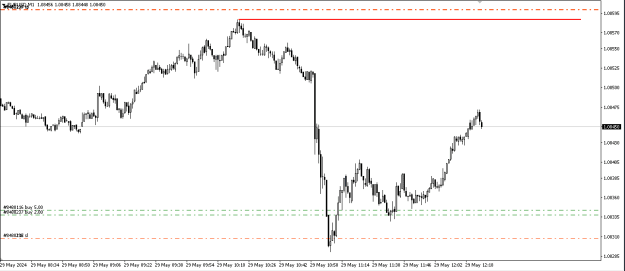
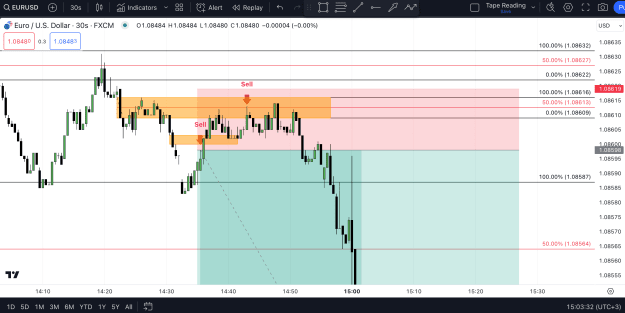
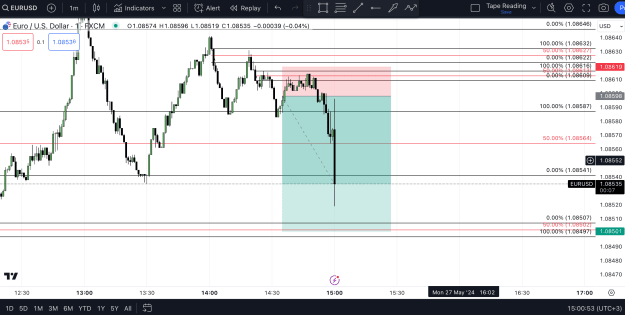
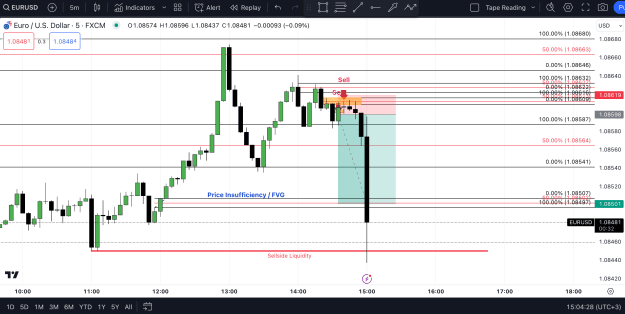
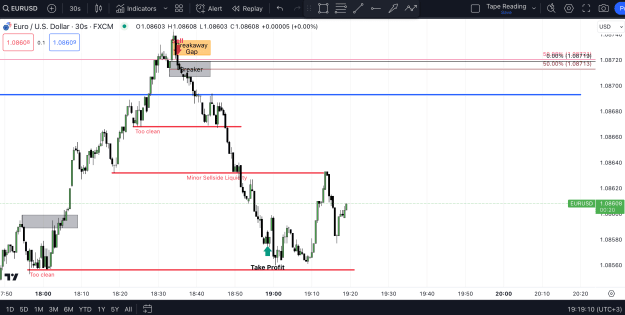
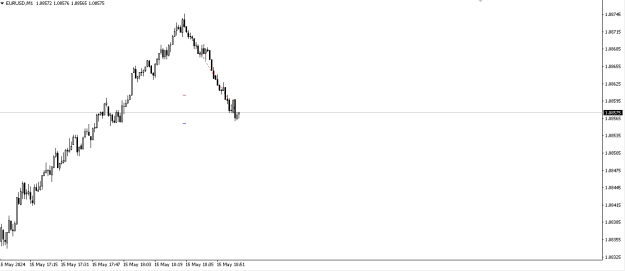
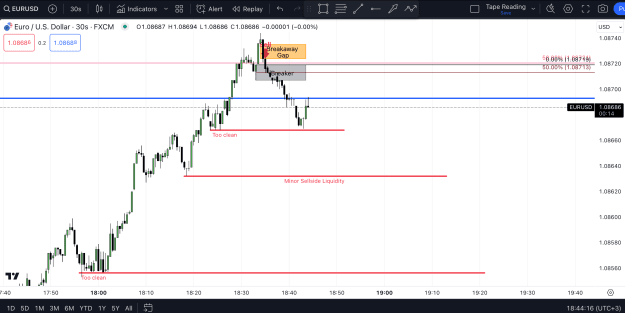
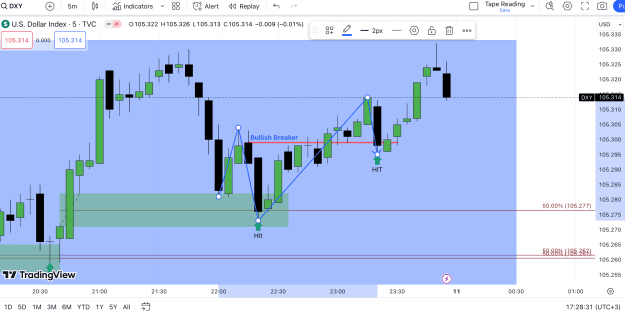
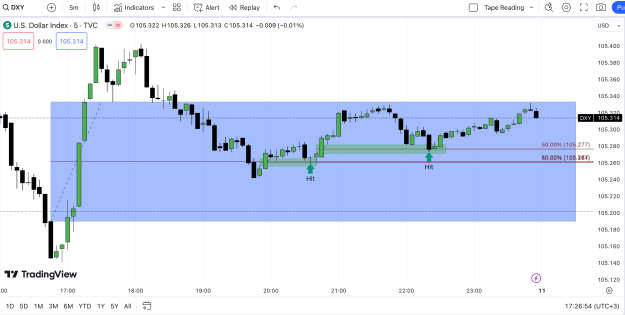
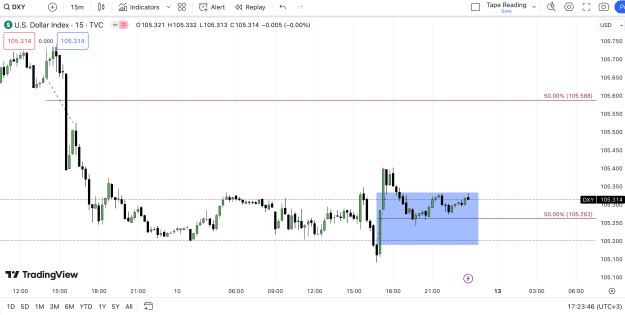
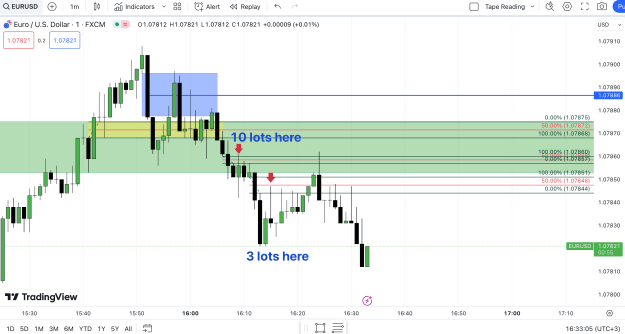
Got into two trades at two fair value gaps on the 30s chart. image In the process of the run. (1m) image Price targeted sellside liquidity and a fair value gap on the 5 min chart. (5m) image Have a good week!
EURUSD only
- stradikus replied May 21, 2024
I see something very interesting. EURUSD is making higher highs but DXY is failing to make lower lows. This shows stability in the dollar index. Expecting the EURUSD to fall. image image
EURUSD only
- stradikus replied May 15, 2024
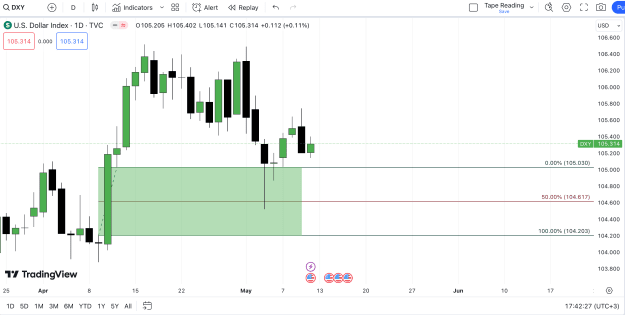
DXY perfectly fills the price inefficiency from the previous gap on the daily chart to gain momentum upwards. image
EURUSD only
- stradikus replied May 15, 2024
Very happy with today's trading. Took a few losses, a few profits too. Last trade +14 pips ahead. Before that I lost 10 and before that +15. Around +1.8% for the day. The trade I managed to precisely catch downhill was great but couldn't hold it ...
EURUSD only
- stradikus replied May 15, 2024
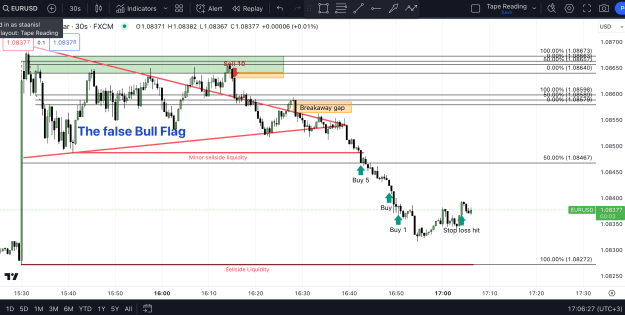
I love false bull flags. image Took some profits with no risk. image
EURUSD only
- stradikus replied May 14, 2024
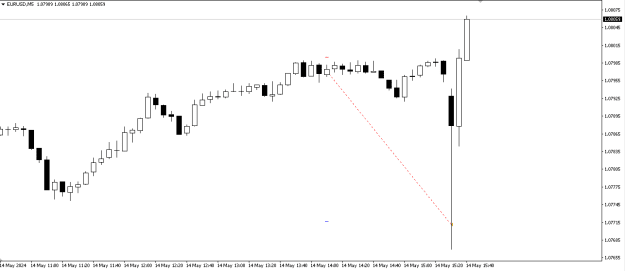
All the red lines indicate the middle of price inefficiencies on different time period - 1W, 1D, 4H, 1H on FVGs and wicks. Look how many they are at this level 1.08. The red line in the middle of the picture shows the Fib from top to bottom of this ...
EURUSD only
- stradikus replied May 13, 2024
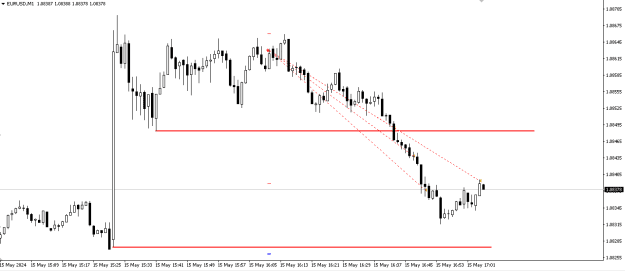
Great time to open a short around 1.07850-55. Dollar index will fill this 5m gap and go up. It may not fill it depending on how much draw on price there is towards sellside liquidity on the EURUSD. image
EURUSD only
- stradikus replied May 12, 2024
Hello all, I am coming up with my bearish weekly/monthly sentiment on the EURUSD. My main analysis is on the Dollar Index which is by my opinion the better analysis to have before starting trading pairs. I will begin showing the analysis of the ...
EURUSD only


- stradikus replied May 12, 2024
Hello all, I am coming up with my bearish weekly/monthly sentiment on the EURUSD. My main analysis is on the Dollar Index which is by my opinion the better analysis to have before starting trading pairs. I will begin showing the analysis of the ...
Only EURUSD


- stradikus replied May 6, 2024
As I said, price reached that level. I have opened positions here: image image Still running, TP will be around 1.0755. Copying trades is your responsibility.
EURUSD only

- stradikus replied May 5, 2024
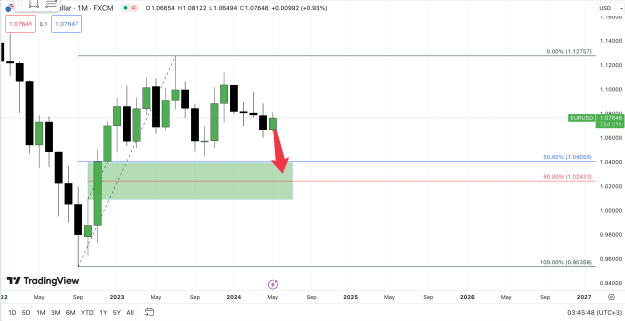
My expectation for today is retracement to the middle of Friday's wick then drop. I'll open a trade on an order block or price inefficiency. I am very bearish. image Price should be heading to 1.02400 on the monthly chart. We have achieved our ...
EURUSD only
- stradikus replied May 2, 2024
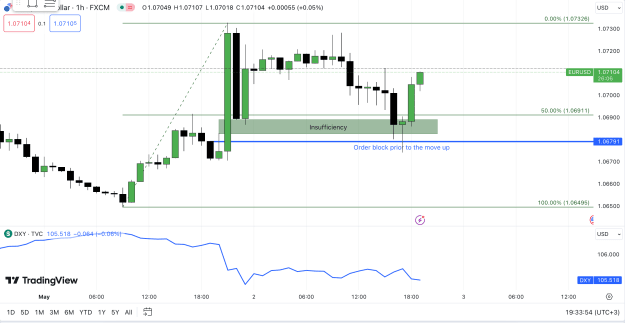
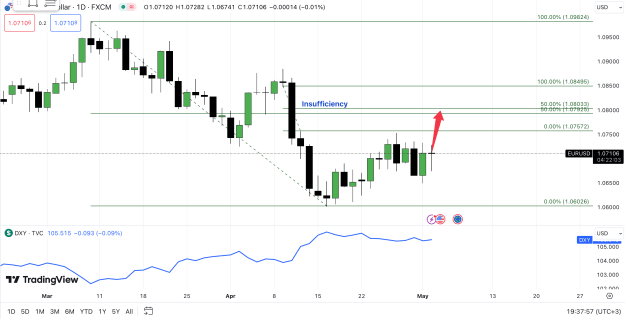
What I see right now is that 1hour ago we had a run down to the order block, filling the insufficiency from yesterday. We can see a good jump from there. image On the Monthly, Weekly and Daily we are still in the discount. What I expect prior to ...
EURUSD only