- Search Energy EXCH
- 13 Results
-
 rubber_ducky replied Nov 22, 2012
Sorry I took so long to add the Moving Average to the indicator. I didn't include the slope of the MA, so you may want to keep the 50 MA on the chart just for that purpose. image I also have been crunching some numbers on excel, and I've come up ...
A-Grace Super System
- rubber_ducky replied Nov 18, 2012
I like the simplicity of your system; very easy to follow. I made an indicator that gives a signal according to the rules and indicators you're laid out for us. Simple to use: - If the red bar appears, go short - If the blue bar appears, go long ...
A-Grace Super System
- rubber_ducky replied Apr 2, 2012
EUR/USD - RSI Divergence — Hope someone picked up on this wonderful RSI Divergence move on EUR/USD. Looks like we even have that Itty-Bitty-Tiny-Little-Winnie RSI Divergence Pattern I mentioned on Friday (marked by grey area)
EASY H1 trading using divergence and candle sticks
- rubber_ducky replied Mar 30, 2012
The Itty-Bitty-Tiny-Little-Winnie RSI Divergence Pattern — Stumbled across this little RSI Divergence pattern the other day. I call it the Itty-Bitty-Tiny-Little-Winnie RSI Divergence Pattern because it only involves two bars... and because it ...
EASY H1 trading using divergence and candle sticks
- rubber_ducky replied Mar 15, 2012
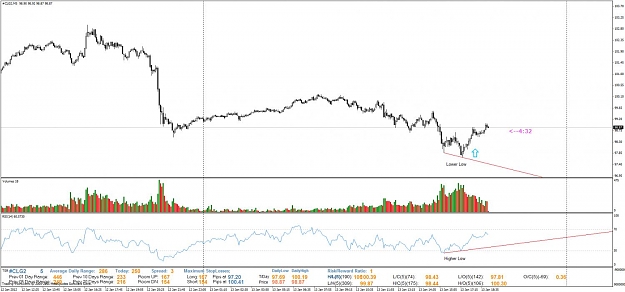
USD/CHF: In Range & Near Support — The USD/CHF exchange has been having a down day so far, but I would expect it to jump up here pretty soon. Reason being: - The Range for USD/CHF (852) is in line with the 30 Day Average Range (832) - ...
USD/CHF
- rubber_ducky replied Mar 15, 2012
USD/CAD: Daily Pivot and Good News — I took a trade with USD/CAD this morning (BUY) thinking that the price will continue to go up after a bounce off the Daily Pivot Line, and from the good news: Unemployment Claims (Current: 351, Forecast: ...
USD/CAD
- rubber_ducky replied Mar 14, 2012
GOLD: Broken Support... New Support? — Gold made a break through of a really good support level, short after bouncing off of it. So now we need to find the new support level, and I think we are coming up to it. There seems to be two close ...
XAU/USD & XAG/USD - Gold & Silver Traders Thread
- rubber_ducky replied Mar 13, 2012
GOLD: Upward Bounce? — With price hitting and bouncing off the downward trending black line, and is also bouncing off the extreme Support line (purple line). This could result in a nice jump upwards.
XAU/USD & XAG/USD - Gold & Silver Traders Thread
- rubber_ducky replied Mar 12, 2012
End of Wave 5? — Looks like we're getting some support from the black trend line shown. End of our Wave 5?
AUD/USD
- rubber_ducky replied Mar 9, 2012
Trend Bounce — AUD/USD traded kinda funny today: negative values for the U.S. Trade Balance and Employment/Unemployment, yet AUD still dropped. Looks like AUD/USD wanted to drop to the black trend line before think about going up. Just goes to ...
AUD/USD
- rubber_ducky replied Mar 8, 2012
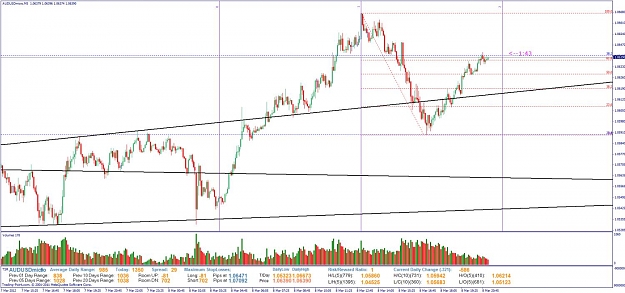
Top...? — Looks like there might be a possible top with AUD/USD; hitting 61.8 and 38.2 Fibonacci Retracement Range. However, the Fibonacci Time Line shows a lengthening in the upward price direction still, and no divergence with CCI, RSI, ...
AUD/USD
- rubber_ducky replied Jan 12, 2012
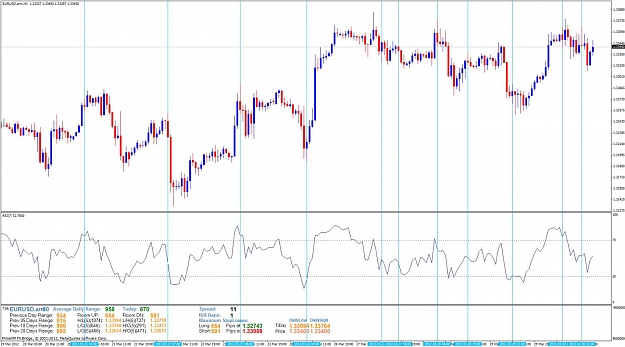
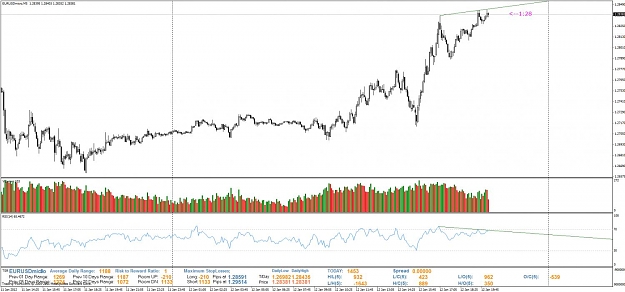
RSI LH, Price HH — Looks like there EURUSD might go down with RSI showing a Lower High, and the Price showing a Higher High... guess we'll see what happens
EURUSD image
image
- Posts by Member Search: 'rubber_ducky'