- Search Energy EXCH
- 20 Results
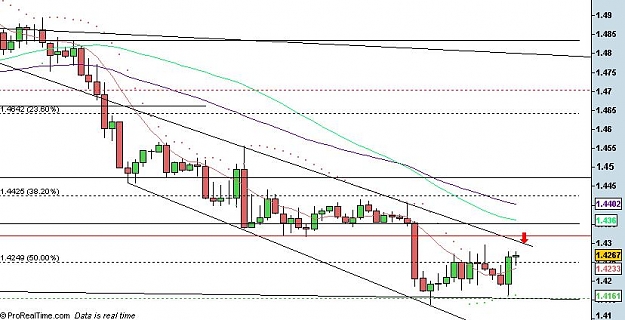
- pmn100 replied Sep 2, 2011
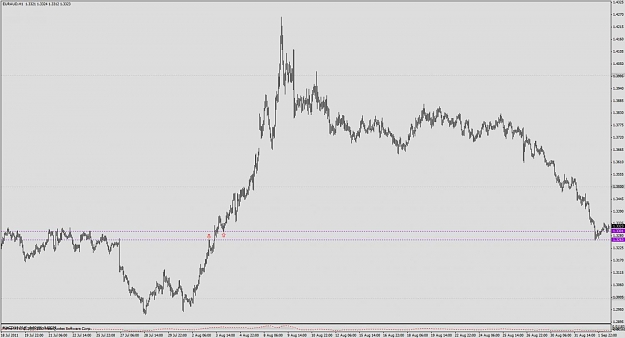
I've attached the H1 chart of E/A. To me, the 1.3300 has already had a rounded retest (upward arrow). So I wouldn't be looking to buy this area on touch. Compare that level to the one below where the highs (downward arrow) were not retested for ...
Fail Better
- pmn100 replied May 26, 2011
I had entry on G/U at precisely 1.6322 (clean H4 PPZ), and FTA at 1.6305. Price hit FTA, retraced back to 1.6322 and rejected down further to the H1 highs at 1.6295. So for me it worked, twice. Wouldn't have been the greatest R/R ratio, but enough ...
LJ Forex Group
- pmn100 replied May 22, 2011
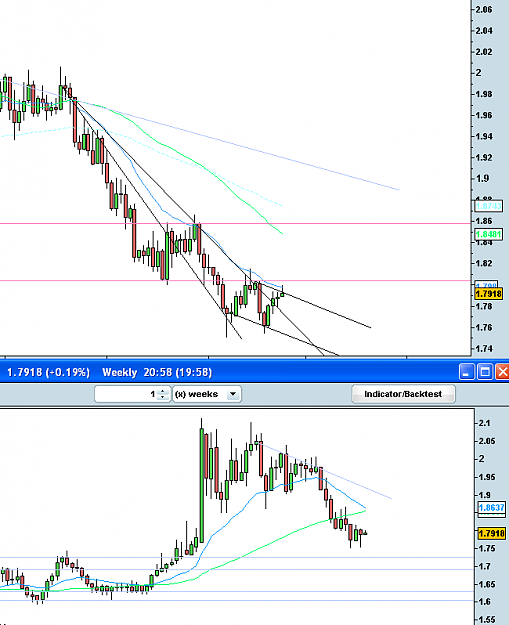
Below is the weekly feed on sigtrader for EUR index! Totally different to LJ's below it. Which is correct?
LJ Forex Group
 image image
- pmn100 replied Mar 9, 2011
And back again. LJ, do you go deeper intraday like this to find 50/61 retraces, or do you prefer to stick to the setups that can be easily seen on a D1 chart? Thanks image
My path to financial freedom
- pmn100 replied Feb 24, 2011
I took a touch long on EUR/CHF today at the 61 fib area shown. First time back. There is obvious risk aversion about at the moment and therefore upside bias for CHF. However, there was clearly a decent bull move here inspite of the obvious downward ...
My path to financial freedom
- pmn100 replied Feb 16, 2011
Hey Mark Took a couple of touch trades today. Could you give your opinions? First GBP/JPY. Yesterday's daily bull bar pushes through multiple highs shown on daily chart. Took touch long at 134.2 as shown on H1 chart. Went to break even at +20 pips ...
My path to financial freedom
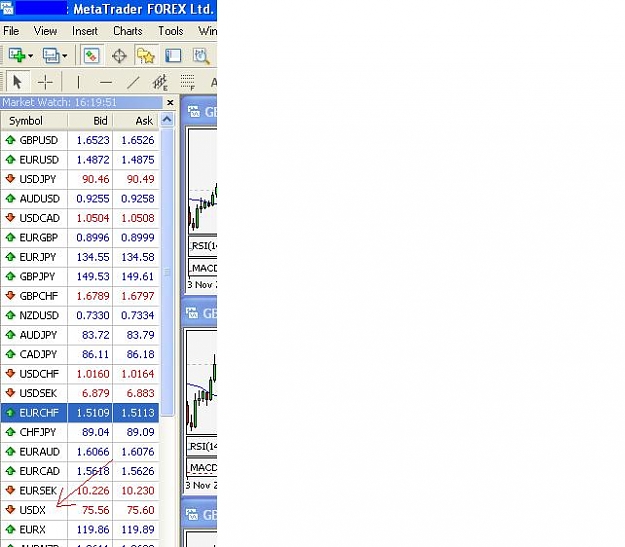
- pmn100 replied Dec 22, 2009
You may have to right click on the list of pairs and click 'show all'. It has the symbol 'USDX'. See attachment.
james16 Chart Thread
- pmn100 replied Oct 8, 2009
G/U 5min with trend pin. Nice 45 degree angle 21ema. Didn't get a chance to get into this but probably would have. What I didn't see in time was that price has retraced to the big daily resistance line where obvious short orders are stacked up. Does ...
Jankone M5 thread
- pmn100 replied Oct 7, 2009
Here's the only two trades I took yesterday. Both E/U 5min. Good to see Ryan taking the first CT pin with div. I was a little unsure and exited too early because the big bearish bars preceeding the pin show evidence of a strong down move. The pin ...
Jankone M5 thread
- pmn100 replied Sep 17, 2009
LOL. Thanks Ryan. I was watching GU M5 today and took note of these 'with trend' pin bars. Do the three pin bars shown on my chart qualify for that type of pin bar, or should we wait for a more definite retrace to the 21ema/mid bollinger. The pin ...
Jankone M5 thread
- pmn100 replied Sep 17, 2009
Thanks for the explaination SC, very useful. For anyone, can you tell me what, if anything, would have kept you out of the trade (attached) EUR/USD M5 chart, pin bar today (7.25 GMT). Also, been going over some of Jankone's charts and he seems to be ...
Jankone M5 thread
- pmn100 replied Jul 21, 2009
Thanks for the reply. I suppose it is like Jankone, but I'm used to seeing the 21ema in there to bounce off. I've attached the chart and highlighted a few BUOBs you didn't take. I think the third was a DBLHC. Thanks
Jankone M5 thread

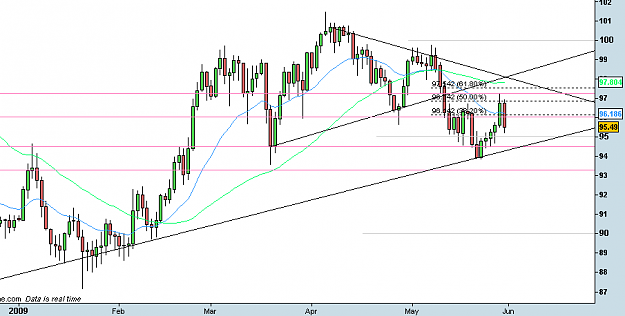
- pmn100 replied May 29, 2009
And here's my feed for USD/JPY No SS, and check out the highs where you took the trendline from, it would be pointing upwards. Just goes to show you can trade what your chart tells you without worrying what other feeds are doing. Looks like price ...
Strat's Long Term Stress Free Trading
- pmn100 replied May 26, 2009
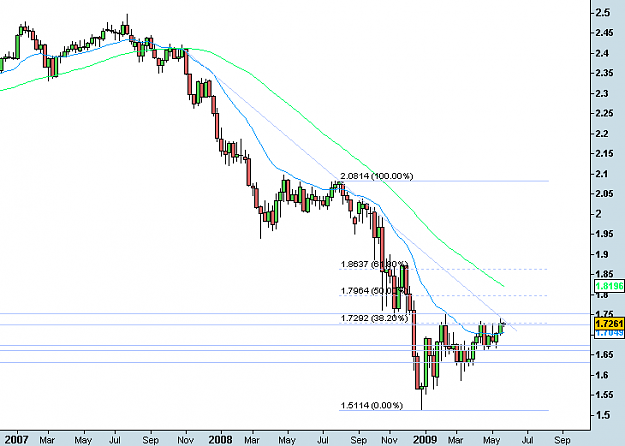
Just to add to this, I've got a downward trendline on the BOSS GBP/CHF, connecting highs at 28th Oct '08, 3rd Aug '08, 14th Sep '08, and price is touching it right now. image
Strat's Long Term Stress Free Trading
- pmn100 replied May 25, 2009
First chart analysis. I'm looking at EUR/AUD BOSS (bottom chart) is down trending. Recent bar was a hanging man, but not at a swing high. Not sure whether to view that as bullish/bearish/neither. WORKER is down trending and still putting in lower ...
Strat's Long Term Stress Free Trading
- pmn100 replied Mar 27, 2009
Concerning the 15m chart below. I was expecting the first circled candle to signal a reversal, but price continued south. The next circled candle, which I believe is an inverted hangman, did result in a reversal. Can anyone tell me the difference in ...
Trade what you see NOT what you expect

- pmn100 replied Mar 19, 2009
How about this one circled (see attached chart)? I thought it was a hangman, but maybe not.
Trade what you see NOT what you expect

- pmn100 replied Mar 4, 2009
Eo, concerning the attached 15m chart, would the candle indicated by the arrow usually indicate a short position on the next open, because the candle closed full and failed to reach the previous highs of the two candles circled. I seem to remember ...
Trade what you see NOT what you expect

- pmn100 replied Feb 12, 2009
Would people agree that there will be heavy selling pressure at the 1.429x area (15m chart shown below), if it reaches there? What's the plan once it gets there?
Cable Update (GBPUSD)
- Posts by Member Search: 'pmn100'