- Search Energy EXCH
- 31 Results
- pipsquick16 replied Mar 3, 2019
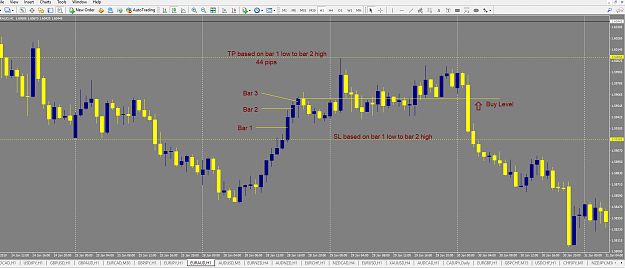
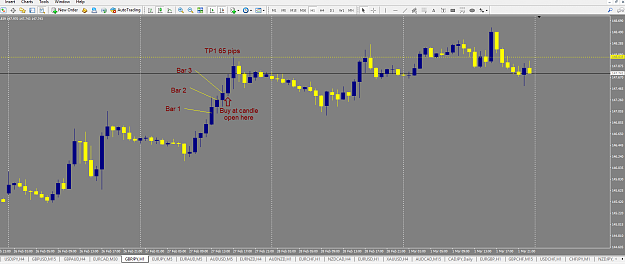
Here is another Buy on Gold (XAUUSD) H1 from Jan 9/2019. FX Cyborgs rules state that it would be preferable if bar 3 closes above bar 2 high, and not just above the close of bar 2, but in this case we are within 0.2 pips short of the high but still ...
[FX/Binary/Nadex] Single Candle S'n'D Technique w/ Low DD's
- pipsquick16 replied Mar 3, 2019
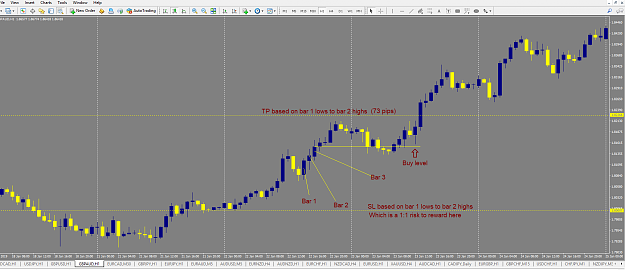
Here is a Buy on the NZDCAD H1 from Jan 25/2019. The TP is where its is because of FX Cyborg's rules, but I would have personally put it at the structural high to the left which is approx 10 pips higher on a live trade. In other words there should ...
[FX/Binary/Nadex] Single Candle S'n'D Technique w/ Low DD's
- pipsquick16 replied Mar 2, 2019
Here is another example of a Sell on the GBPAUD H1 from Oct 26/2018. As you can see price kept going almost 200 pips past the TP, so some of these set ups can make you a lot of money if you wanted to turn it into a swing trade.
[FX/Binary/Nadex] Single Candle S'n'D Technique w/ Low DD's
- pipsquick16 replied Mar 2, 2019
This is another Buy example on the EURAUD H1 from Jan 28/2019
[FX/Binary/Nadex] Single Candle S'n'D Technique w/ Low DD's
- pipsquick16 replied Mar 2, 2019
Here is another method 3 Buy example on the GBPAUD H1 from Jan 22/2019. As you can see there could have been more TP levels if it was a swing trade.
[FX/Binary/Nadex] Single Candle S'n'D Technique w/ Low DD's
- pipsquick16 replied Mar 2, 2019
Here is another example from the EURJPY H1, method 3 Buy from 2 days ago.
[FX/Binary/Nadex] Single Candle S'n'D Technique w/ Low DD's
- pipsquick16 replied Mar 2, 2019
Here is another example from USDCAD M5 from yesterday. Obviously common sense would tell us that the TP's will vary from time to time frame. The smaller time frames will produce lower returns and the higher time frames higher returns, which will ...
[FX/Binary/Nadex] Single Candle S'n'D Technique w/ Low DD's
- pipsquick16 replied Mar 2, 2019
Here is an example of a Buy on the GBPJPY H1 chart according to FX Cyborgs method 3 rules of engagement.
[FX/Binary/Nadex] Single Candle S'n'D Technique w/ Low DD's
- pipsquick16 replied Feb 24, 2019
I see a potential up coming Sell set up as shown on my screen shot.
High Level Accuracy Method With Little To NO Draw-down
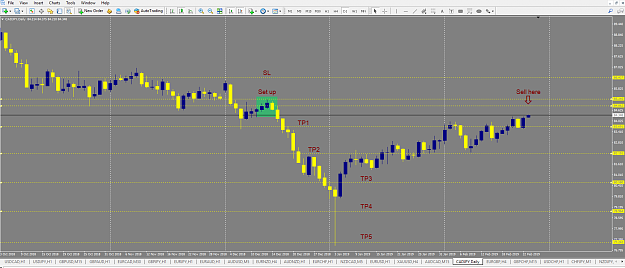
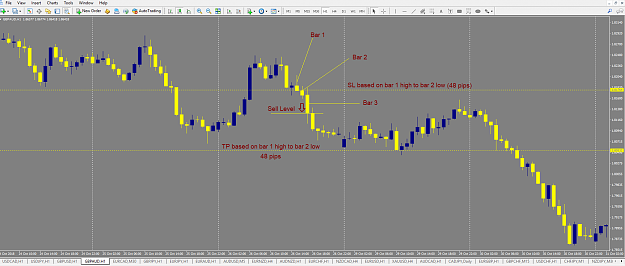
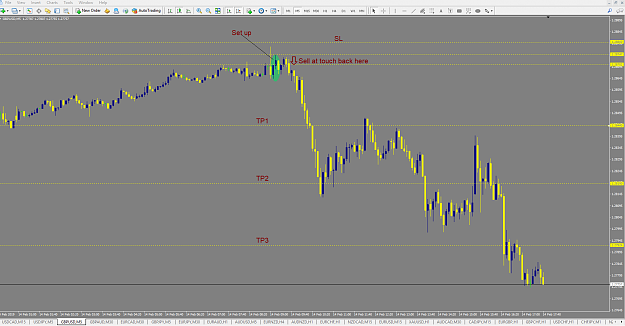
- pipsquick16 replied Feb 20, 2019
Here is a Sell set up on the EURCAD H1 chart. Obviously bar 1 is huge because of US retail sales report. I have 2 questions for FX Cyborg, 1. Would you have taken this trade with bar 1 being so big after this news ?? 2. In light of the fact that ...
High Level Accuracy Method With Little To NO Draw-down
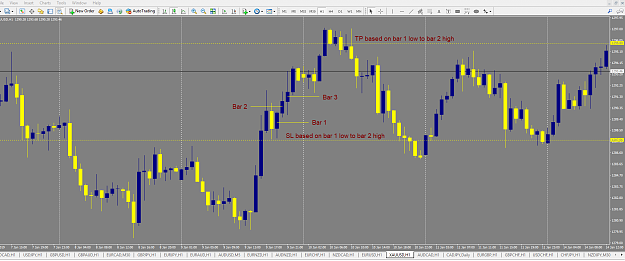
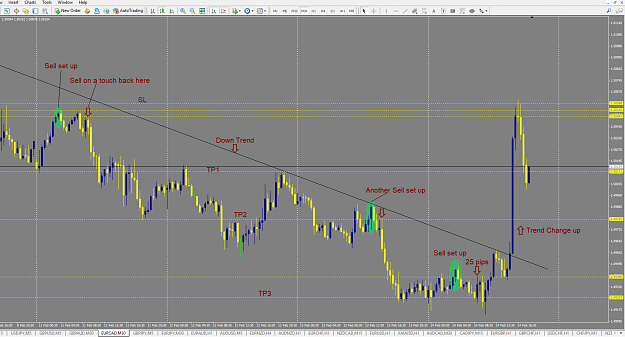
- pipsquick16 replied Feb 14, 2019
First of all you are in a down trend and should only be selling, but for demonstration purposes I will show you as if it was a real Buy set up. For me the TP levels are by far the easiest to find, and for me there is a lot more thinking involved ...
High Level Accuracy Method With Little To NO Draw-down
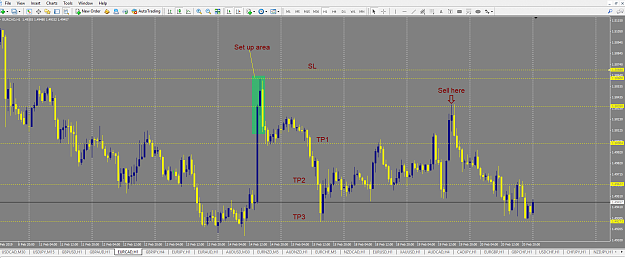
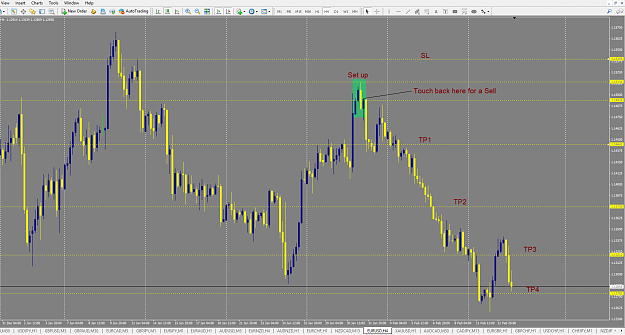
- pipsquick16 replied Feb 14, 2019
Here is a 4 day Sell on the EURCAD H30 pair. Depending on where you had your TP's from the first Sell at 1.50540, you then had another 2 Sell set ups, if you wanted to add or missed the first Sell. This is a great example of when you have perfect ...
High Level Accuracy Method With Little To NO Draw-down
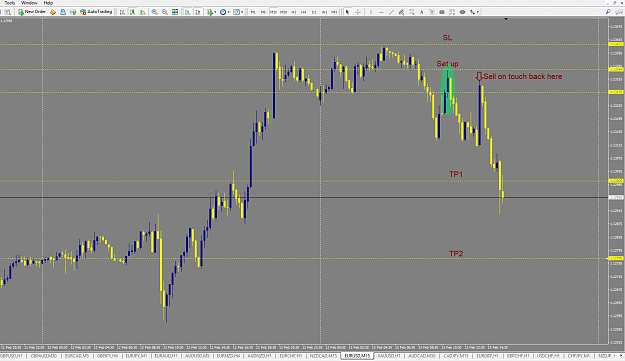
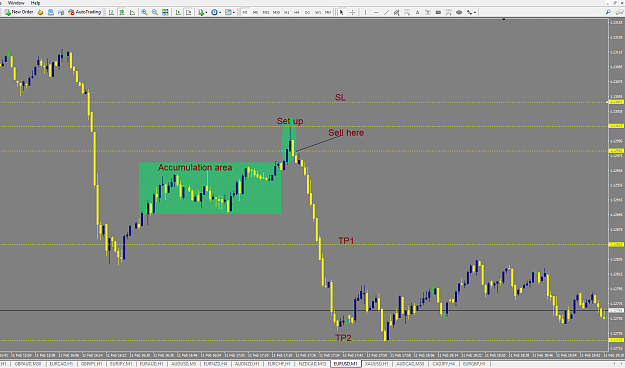
- pipsquick16 replied Feb 14, 2019
Here is a Sell trade on the GBPUSD M5 from today. A nice accumulation zone, its a down trend on H1/H4 and then we get a 3 bar set up as per FXC rules.
High Level Accuracy Method With Little To NO Draw-down
- pipsquick16 replied Feb 13, 2019
Here is another Sell set up on the EURUSD H4 pair. Everyone is going to go wait a minute its a sell in an up trend. When you are an experienced trader you can see when a trend change is about to happen. This set up happened right at the 78.6 fib, of ...
High Level Accuracy Method With Little To NO Draw-down
- pipsquick16 replied Feb 13, 2019
Here is a EURUSD Sell set up from today off of the M15 chart.
High Level Accuracy Method With Little To NO Draw-down
- pipsquick16 replied Feb 13, 2019
Here is a EURAUD Sell set up from today on the M30 chart.
High Level Accuracy Method With Little To NO Draw-down
- pipsquick16 replied Feb 12, 2019
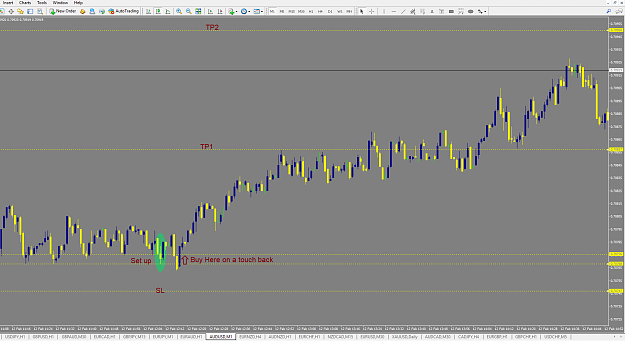
Here is another nice Buy set up on today's AUDUSD M1. We are in an up trend on M1/M5, sideways on H1. You can see the consolidation zone, set up and touch back for the Buy. Look how strong that Buy level is and how many times it was respected before ...
High Level Accuracy Method With Little To NO Draw-down
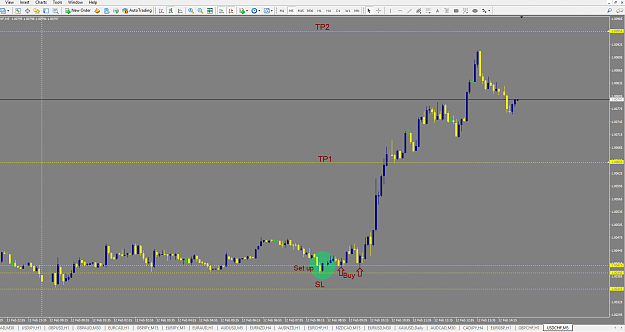
- pipsquick16 replied Feb 12, 2019
Here is a nice Buy set up for from today's USDCHF M5 chart. We are in an up trend and you can clearly see the accumulation zone prior to the set up, then the 2 touch backs for the Buys.
High Level Accuracy Method With Little To NO Draw-down
- pipsquick16 replied Feb 11, 2019
Please post screen shots with the whole chart so i can see the times and date at the bottom. Because my broker is different and I cant see the time, I cannot match your candles. Your set up seems good, but go back 7 candles and that would have been ...
High Level Accuracy Method With Little To NO Draw-down
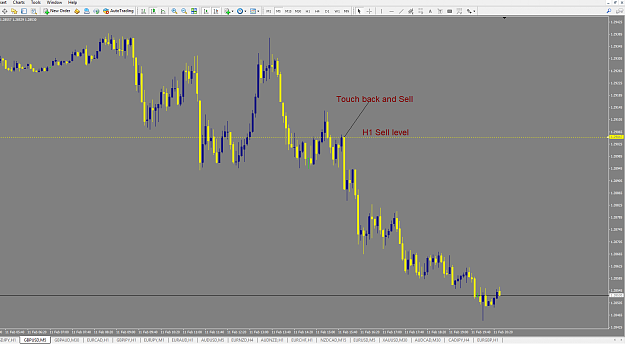
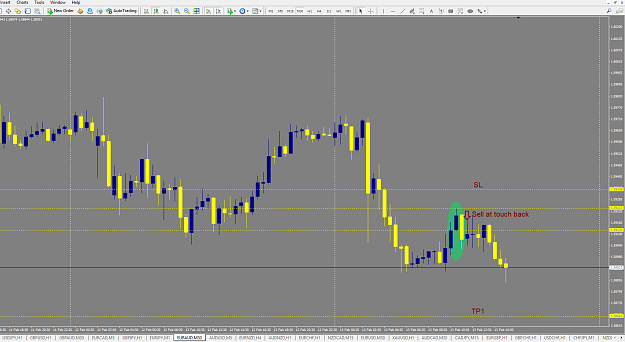
- pipsquick16 replied Feb 11, 2019
Price did pull away by 10 pips, then went up to touch the Sell level. If you look at the M5 chart you can clearly see the touch of that level at 1.29047. I have attached a screen shot on the M5 to show the touch back.
High Level Accuracy Method With Little To NO Draw-down