- Search Energy EXCH
- 170 Results (1 Thread , 169 Replies )
-
 pipskidnapper replied Oct 10, 2007
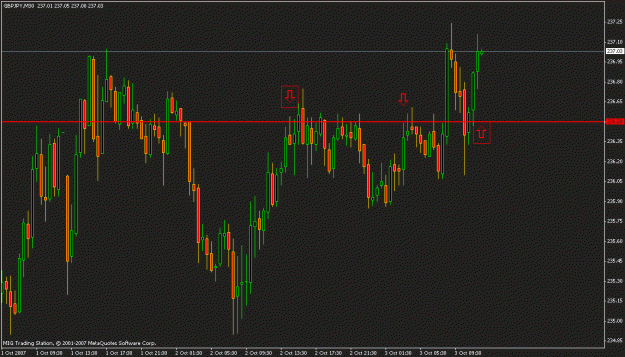
seems we have support piont @ 239.40 on 1h TF .... if the price cuoldn't break it down to 239.10 on our TRGT may we will change TRGT from 239.10 to 239.40 ... but now i see it is better to be satisfied with 85 pips or less guys
Brave Heart of GBP/JPY
- pipskidnapper replied Oct 10, 2007
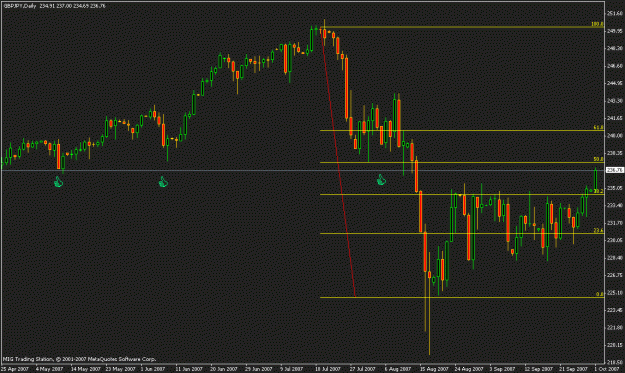
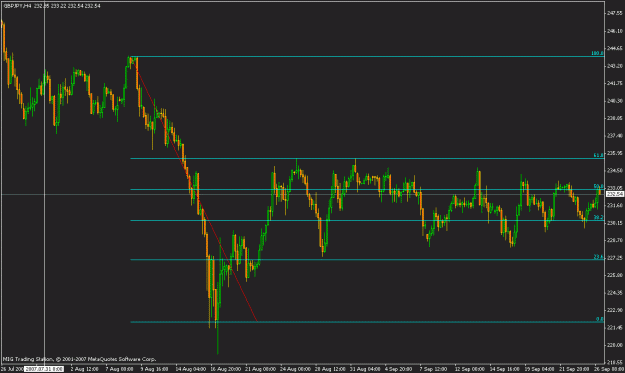
the price arrive astrong resistance around price 240.00 ON 61.8% FIBO enter short TRGT 239.10 S/L 100
Brave Heart of GBP/JPY
- pipskidnapper replied Oct 3, 2007
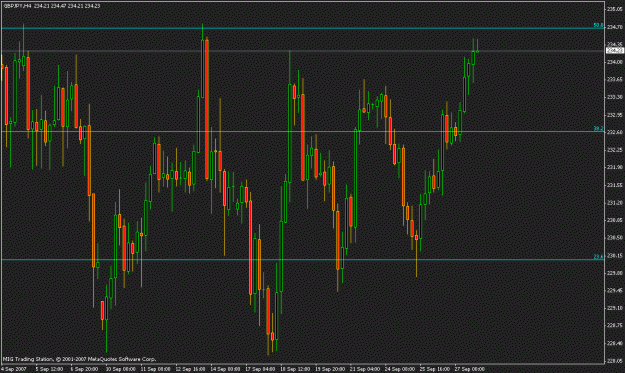
TRGT @ the first support .. 236.50 do not 4get S/L 100
Brave Heart of GBP/JPY
- pipskidnapper replied Oct 3, 2007
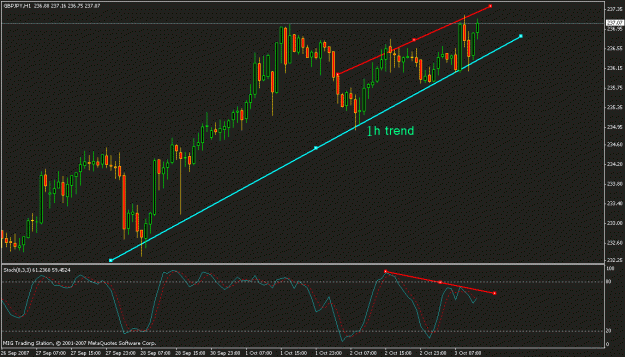
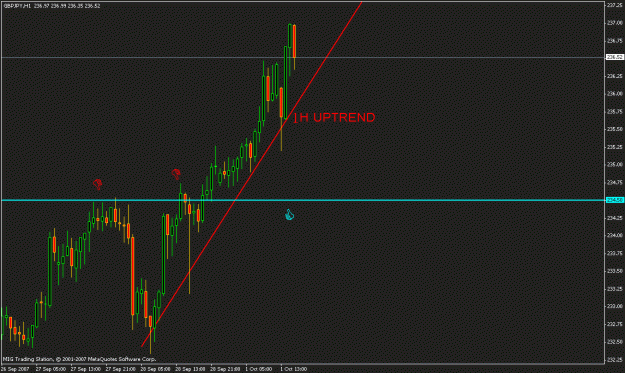
divergence on 1h TF .... the @ 237.10 ... sell now ....
Brave Heart of GBP/JPY
- pipskidnapper replied Oct 2, 2007
as we expected ... the price exactly retreated from 61.8% .. then mad up trend ... this frame refers to 1h but the fibo was drown on daily TF
Brave Heart of GBP/JPY
- pipskidnapper replied Oct 1, 2007
WE WILL SEE ABATTLE BTWN BEARS AND BULLS IF THE PRICE WILL ARRIVE 237.50 PRICE
Brave Heart of GBP/JPY
- pipskidnapper replied Oct 1, 2007
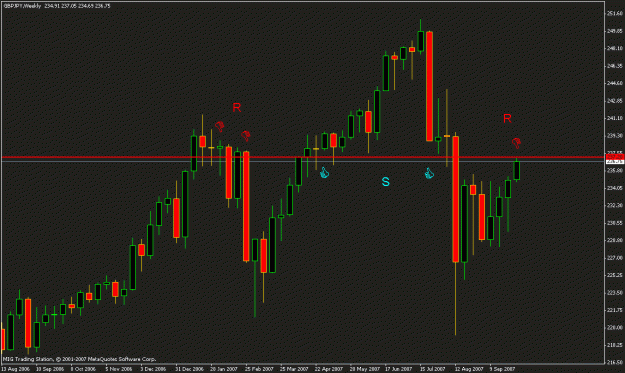
last two weeks were the quarter of 2007 year and many counting of the companies & banks were made in these period .. the market was very disturbed and the trader confused...and many stop loses were hit. on of them was mine...... and my strategey ...
Brave Heart of GBP/JPY
- pipskidnapper replied Oct 1, 2007
not yet.... we have around 150 pips at least of oscillation.... it could arrive 238.00 ... we have not aconfirmation of down.... it must break the up trend on 1h TF and we have avery strong support @ 234.50 must be broken also
Brave Heart of GBP/JPY
- pipskidnapper replied Oct 1, 2007
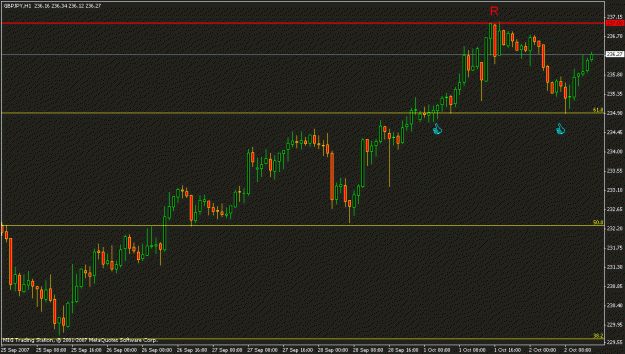
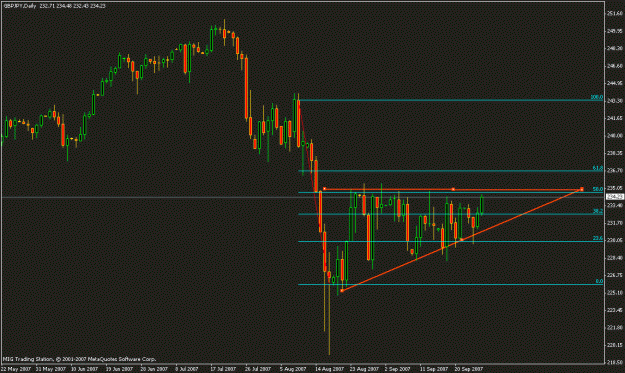
now the price arround the most resistance since 2 months @ about 237.00 or 237.50 >> it retreated from this point on 10/05/2007 >> 09/06/2007 & 11/08/2007 >> this resistance @ 50% from the highest price @ 251.00 to the lowest price @ 219.00 but i ...
Brave Heart of GBP/JPY
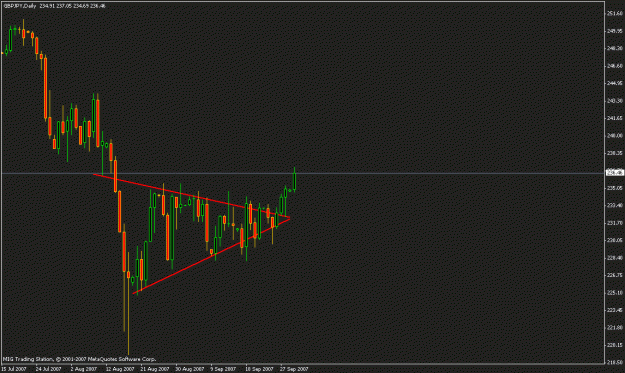
- pipskidnapper replied Sep 27, 2007
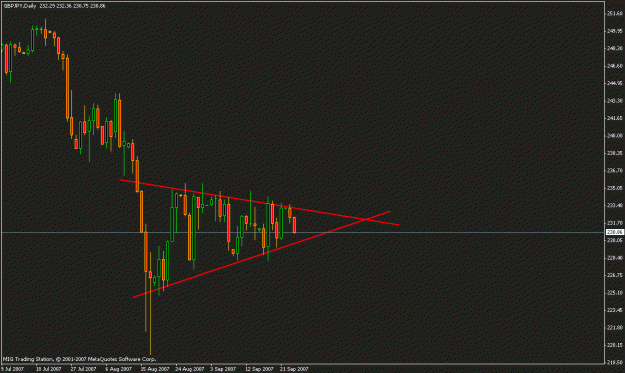
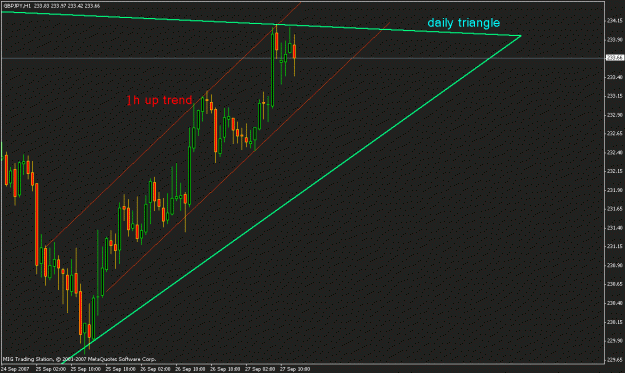
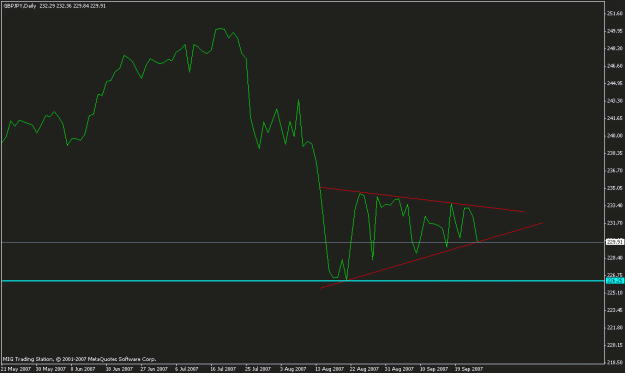
this is the triangle on daily TF ..... the price now is near the most resistance point @ 234.70 on the upper line of the triangle & 50% fibi on the same daily TF ..... closing the present candle on 4h TF below 50% & 234.70 price meanes we have a ...
Auslanco - GBP/JPY and GBP/USD (newstrade)
- pipskidnapper replied Sep 27, 2007
we have uptrend on 1h TF & daily triangle .. we will see if this high TF will rule low TF
Brave Heart of GBP/JPY
- pipskidnapper replied Sep 27, 2007
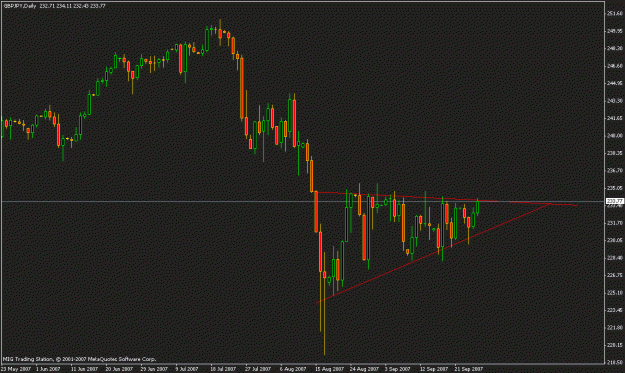
you are rigth karm.... yesterday i saw these news but i did not care that was my mestake... so now we strong resistance @ 234.50 or arround it on the upper line of the triangle on daily TF .... closing above this line means we will see anew ...
Brave Heart of GBP/JPY
- pipskidnapper replied Sep 26, 2007
now short guys @ 232.60... TRGT 231.60.. S/L 100
Brave Heart of GBP/JPY
- pipskidnapper replied Sep 26, 2007
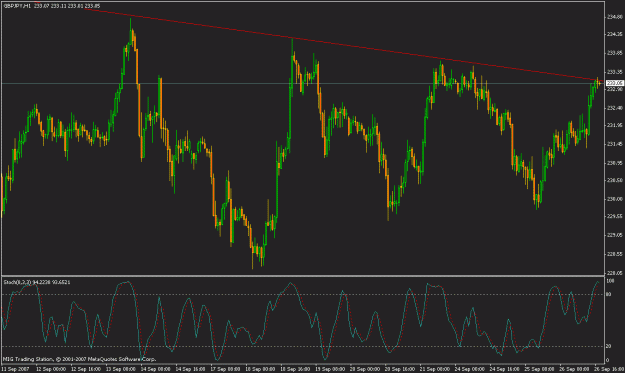
now guys the rascal arrived the upper line of the triangle on daily TF .....chart is on 1h TF ... be ready..... breaking this line means going up untill 235.00 price ... but now we are in the embarrassment area ... and over bought on stochastic.. ...
Brave Heart of GBP/JPY
- pipskidnapper replied Sep 25, 2007
we did not mmiss the train jacob ... it is the news and the rascal moved vastly... but generally 230.00 is asupport level....
Brave Heart of GBP/JPY
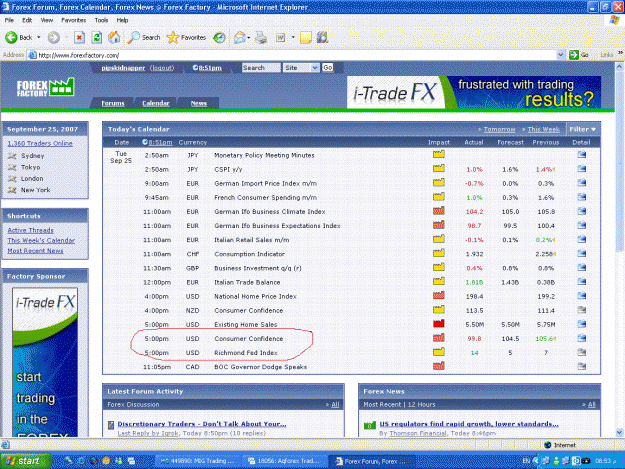
- pipskidnapper replied Sep 25, 2007
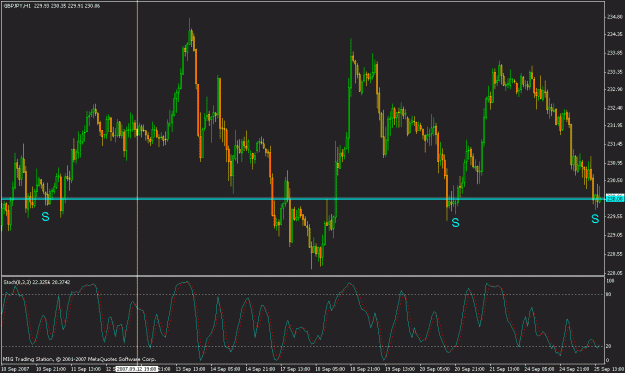
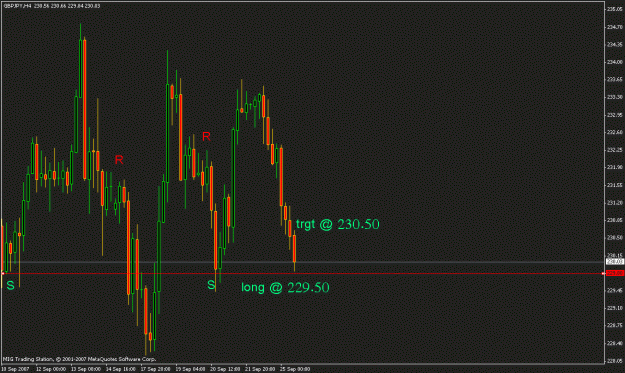
I THINK 230.00 IS VERY STRONG SUPPORT PIONT... AND IT IS BETTER TO ENTER @ THE LOWEST POINT AROUND THIS SUPPORT @ 229.50... SO WE WILL NOT ENTER LONG BEFORE THE PRICE ARRIVE 229.50 TO GIVE OUR S/T CHANCE IN THE EVENT ARRIVING DOWN UNDER 228.00 IN ...
Brave Heart of GBP/JPY
- pipskidnapper replied Sep 25, 2007
hi davido... nice to be here.. we should depened on the line chart coz of the price of closing... so if the present candle on daily TF will close under the traingle and we will get aconfirmation of continuation of down moving tomorrow it will go ...
Brave Heart of GBP/JPY
- pipskidnapper replied Sep 25, 2007
even the price arrive 229.50 enter long ... TRGT @ 230.50
Brave Heart of GBP/JPY
- pipskidnapper replied Sep 24, 2007
we are closing to the down line of the triangle on daily TF
Brave Heart of GBP/JPY