- Search Energy EXCH
- 205 Results
- mktjong replied Jun 30, 2014
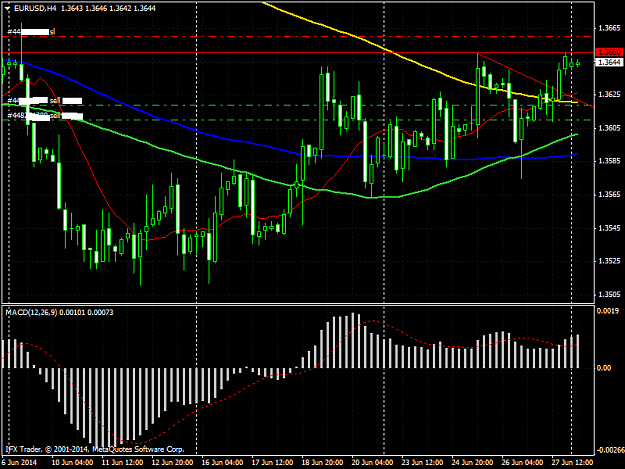
It's strange this pair is still supported by some funds ..hmmm A bit under the water, but I keep selling this pair, profit open
EURUSD
- mktjong replied Nov 10, 2009
Here u go, it's a proprietary software tho
Auslanco - GBP/JPY and GBP/USD (newstrade)
- mktjong replied Oct 27, 2009
Just an educated guess — If AC = BD plays out, would see 147 by tomorrow
Auslanco - GBP/JPY and GBP/USD (newstrade) 
- mktjong replied Oct 19, 2009
Down to 145 area before another upmove? — It looks kinda toppie now, sitting at 38.2% fib level.. hhmm ..
Auslanco - GBP/JPY and GBP/USD (newstrade)
- mktjong replied Oct 13, 2009
Looks like above 143 is a sell region ..
Auslanco - GBP/JPY and GBP/USD (newstrade) Bearish div ..
- mktjong replied Oct 12, 2009
UK treasuries is really weak at the moment, if it stays like this when closes. So, I'd see GY trade southbound ..
Auslanco - GBP/JPY and GBP/USD (newstrade)
- mktjong replied Oct 6, 2009
Daily GU analysis — We see the daily bar closed bearish with volume closed higher as well. I think we would likely see 1.5350 area this week considered 1.58 support has been broken. The ultimate goal is 1.44 area
Cable Update (GBPUSD)
- mktjong replied Oct 1, 2009
See chart .. — Based on popular and proven formula AB = CD, we could see GY down to 134 area. I probably would tp it at that level and it could be as early as next week
Auslanco - GBP/JPY and GBP/USD (newstrade)
- mktjong replied Oct 1, 2009
Next couple of trading days — If today's close lower than open price, then we likely see the 139 level again ..
Auslanco - GBP/JPY and GBP/USD (newstrade)
- mktjong replied Sep 24, 2009
It is way too oversold .. imo — If this bullish div plays out, could be a 200 pips potential.
Auslanco - GBP/JPY and GBP/USD (newstrade)
- mktjong replied Sep 23, 2009
If it closes below 1.6420, short has the call .. — Bearish div, it shouldn't go far
Cable Update (GBPUSD)
- mktjong replied Sep 23, 2009
This is totally insane, someone is playing this 5 min Bollinger band, very tight range. He is gonna get burned badly.. How dare u play this range with Geppy .. unbelievable.
Auslanco - GBP/JPY and GBP/USD (newstrade)
- mktjong replied Sep 6, 2009
Let's see whose is gonna play out. There is a huge bearish divergence on 30m chart with low volume upthrust.
Auslanco - GBP/JPY and GBP/USD (newstrade)
- mktjong replied Sep 2, 2009
Mal, this is a daily chart. See the high volume with low spread and closed above the mid level. This is a bullish sign, right?
Auslanco - GBP/JPY and GBP/USD (newstrade)
- mktjong replied Aug 31, 2009
That's right. I just wanted to post the same chart and the Bullish div has played out imo (see the red arrow level, same as yours).
Auslanco - GBP/JPY and GBP/USD (newstrade)
- mktjong replied Aug 26, 2009
Just be careful for all shorts .. — We may already have seen the low of today. Bullish div on 4H and high volume traded at today's low. This is just for reference purposes.
Auslanco - GBP/JPY and GBP/USD (newstrade)
- mktjong replied Aug 25, 2009
A typical behavior .. — Re-testing the broken trendline ..
Auslanco - GBP/JPY and GBP/USD (newstrade)
- mktjong replied Aug 21, 2009
If the upcoming news "Existing home sales" is good, it may likely explode to the upside. Yesterday down on 4H macd showed bullish div and hidden bullish div on CCI. Btw, I don't use this chart to trade, just for illustration purposes
Auslanco - GBP/JPY and GBP/USD (newstrade)
- mktjong replied Aug 20, 2009
It's currently hitting a trendline .. pound .. pound .. more .. pound .. we may need London's help
Auslanco - GBP/JPY and GBP/USD (newstrade)