- Search Energy EXCH
- 12 Results
- leomel85 replied Sep 21, 2016
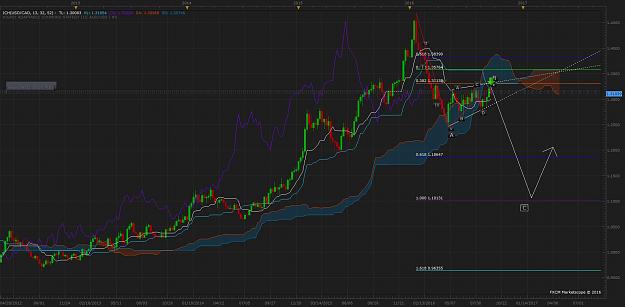
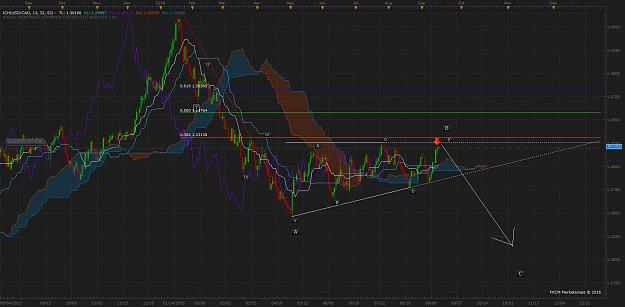
Looks like beginning of new trend, EWP analysis looks like the end of wave e of an ascending triangle, ending a correction that started in in may 2016. This is a low risk high yield shorting opportunity. Which if this is the start of wave C in a ...
USD/CAD
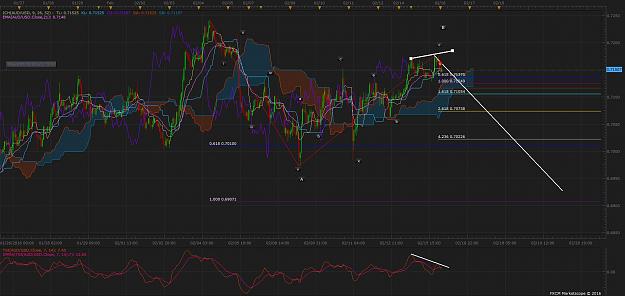
- leomel85 replied Sep 15, 2016
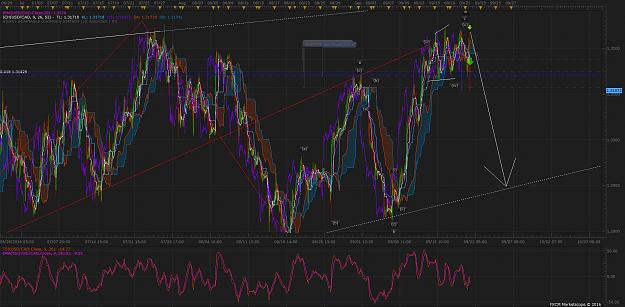
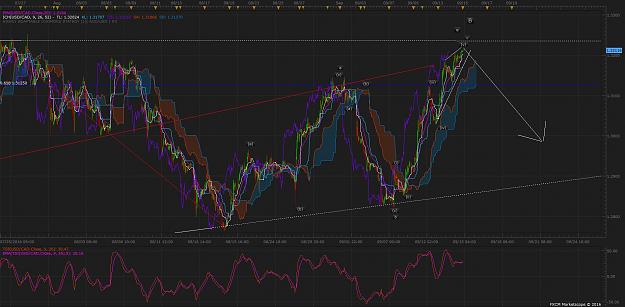
Big trading opportunity for all traders. I see an ending diagonal for wave 5 of c wave, for wave e, of an ascending triangle, which is completing wave B on a large degree abc correction. Look to go short for the beginning of C
USD/CAD
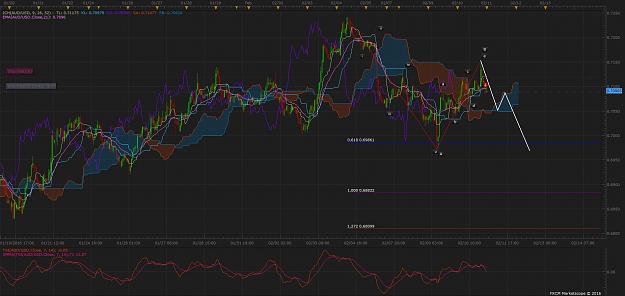
- leomel85 replied Feb 16, 2016
On the Chart show a few technical indicators of short term trend reversal, first it looks like we are ending a double zizag represented by wave a,b,c,x,a,b,c. Second good indicator is the TSI and price has a divergence, shown on the cart. Going ...
AUD/USD
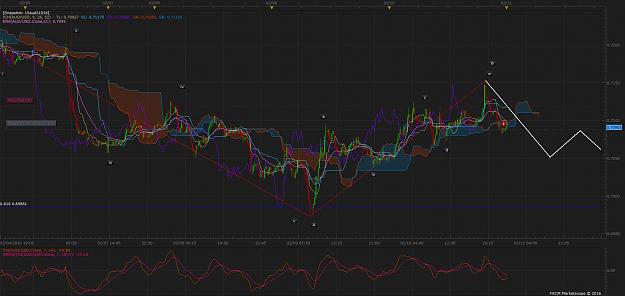
- leomel85 replied Feb 11, 2016
Hey fellow traders! The fifteen minute chart appears to show signs of reversal of the corrections that is labeled a,b, and c on the chart, back towards it bearish movement with possible resistance levels .70500, and then if it breaks that level look ...
AUD/USD
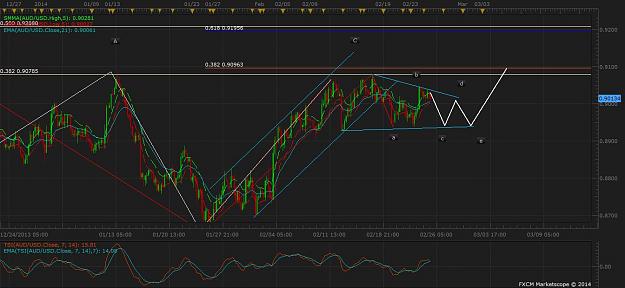
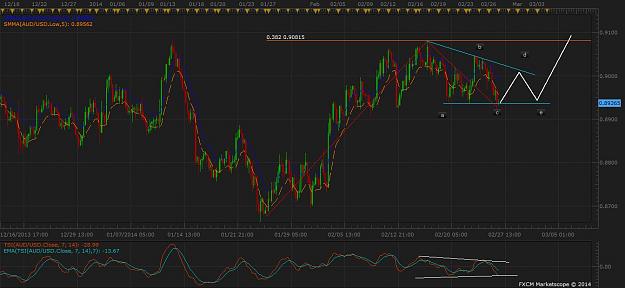
- leomel85 replied Feb 28, 2014
Holding long TP at .89950 near the top of triangle image image image
AUD/USD
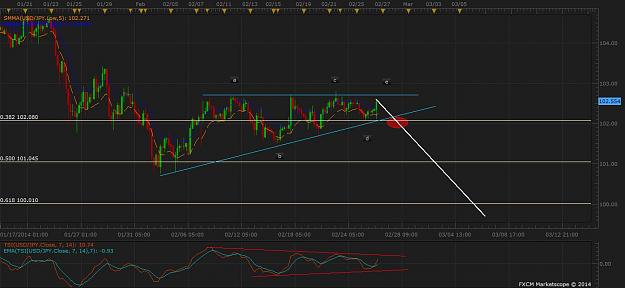
- leomel85 replied Feb 27, 2014
I believe your on the right track my analysis is a little different, I see ascending triangle, flat top, rising bottom
USD/JPY Discussion
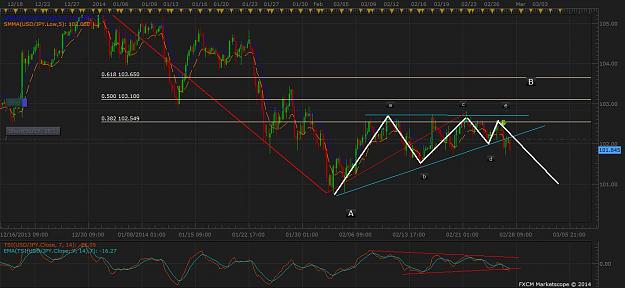
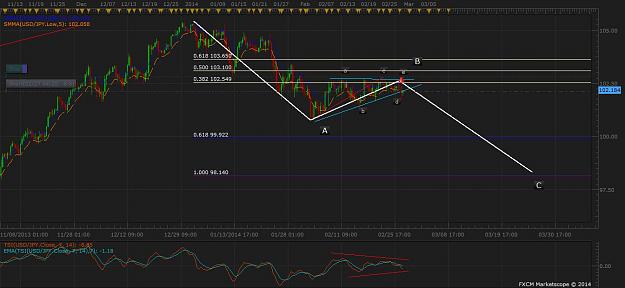
- leomel85 replied Feb 27, 2014
Good shorting opportunity indeed, as we are the end of a horizontal triangle, which ends B wave in a ABC Zig Zag. Signals point to beginning of the C wave. I am in on a short at 102.115 SL 102.820 TP 98.140 trade length possibly 20-30 days
USD/JPY Discussion
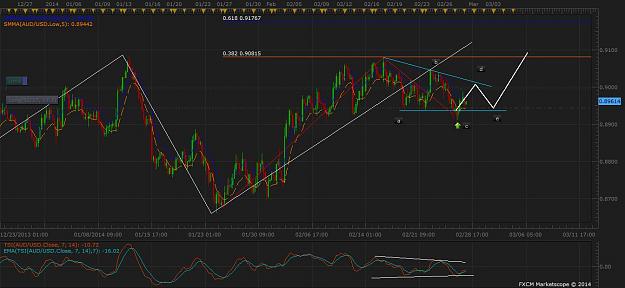
- leomel85 replied Feb 27, 2014
If this wave holds resistance at the bottom of triangle support look for it to move back toward the top of the triangle.
AUD/USD


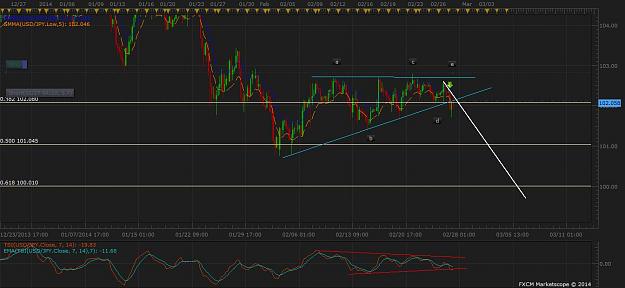
- leomel85 replied Feb 26, 2014
looking for possible short entry at 102.00, just as it break out of triangle support. Thoughts?
USD/JPY Discussion
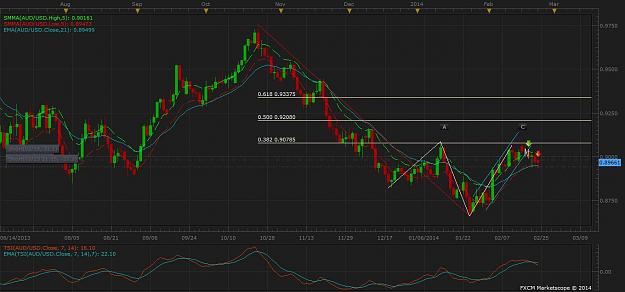
- leomel85 replied Feb 25, 2014
Look like wave C in larger ABC expanded flat is not finished, looks like a triangle maybe forming indicating more upside for later in the week or possible early next week
AUD/USD

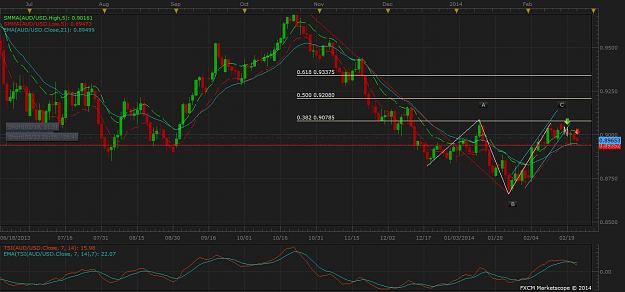
- leomel85 replied Feb 24, 2014
look at the ABC correction highlighted in white, its an expanded flat, notice the B wave move, traded below the start of A wave indicating the market wants to move strongly in the direction of B wave however the retracement hadn't completed and ...
AUD/USD
- Posts by Member Search: 'leomel85'