- Search Energy EXCH
- 57 Results
-
 fxlover11 replied Feb 20, 2014
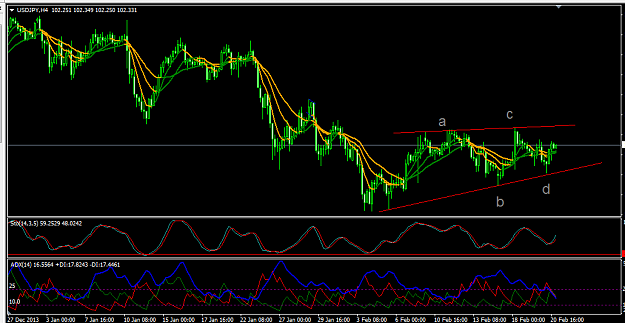
UJ is in a ascending triangle. Last day indices were bullish. Now have to see which side it breaks out... image
USD/JPY Discussion
- fxlover11 replied Feb 15, 2014
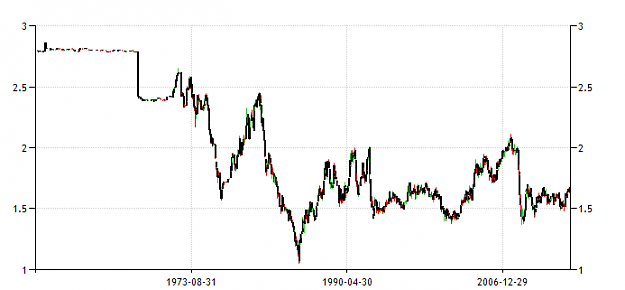
Long term chart.... from 1976 image From 1957.... image
Cable Update (GBPUSD)
- fxlover11 replied Feb 2, 2014
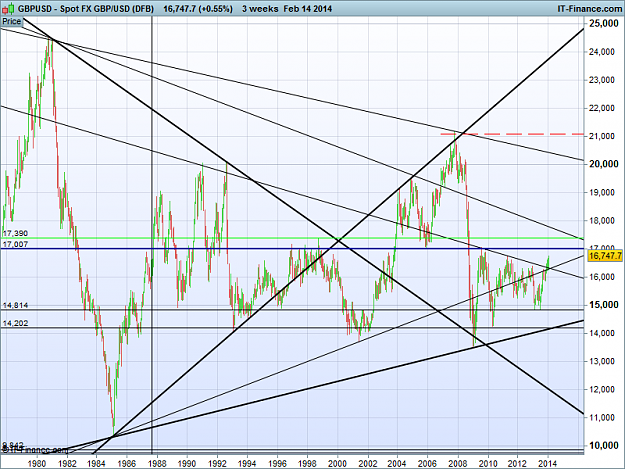
Cable closed in Friday below MA and below support which may become resistance for now. It is at the bottom of channel in H4 but I can see there is much room downside before another support if it break that channel . image
Cable Update (GBPUSD)
- fxlover11 replied Dec 8, 2013
If the previous large wave is wave 1 then it may not be a triangle but will be a sideway wave 2 correction. As wave 2 can't be a triangle. Again if the previous wave is wave A then it can be a wave B triangle. Btw at first we have to see whether ...
EurAnalysis
- fxlover11 replied Dec 7, 2013
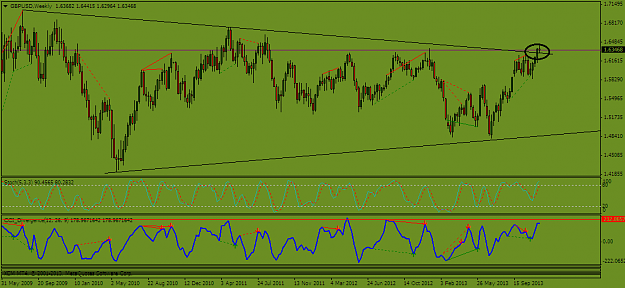
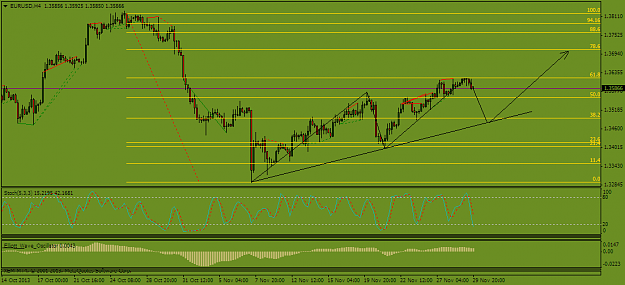
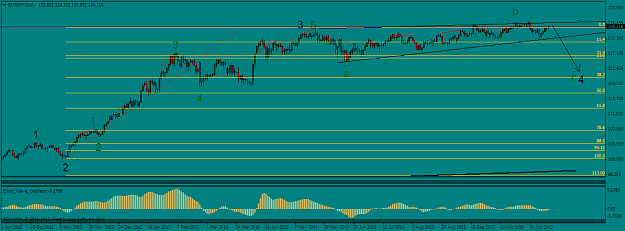
Two week ago GU broke the upper tl of triangle and last week it tested the tl again and failed to break . So there is possibility of strong bull run if it remain higher from 1.6280 or can't break the tl confidently from upside. image
Cable Update (GBPUSD)
- fxlover11 replied Dec 7, 2013
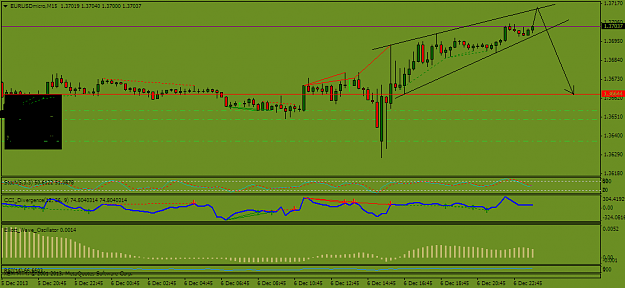
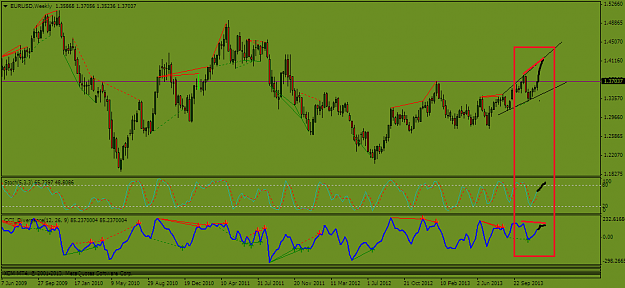
In small tf like m15 there is possibility of small pullback. image But in longer tf like weekly there is much space technically to further up. So next week we may see a fresh high above 1.3830. image
EurAnalysis
- fxlover11 replied Dec 5, 2013
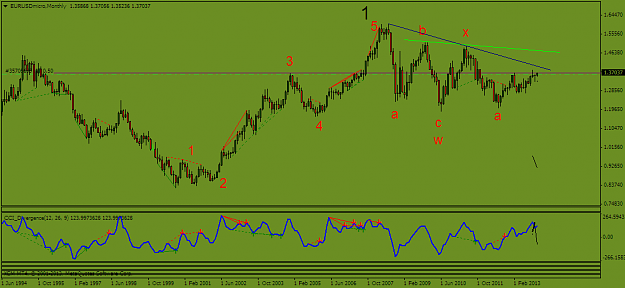
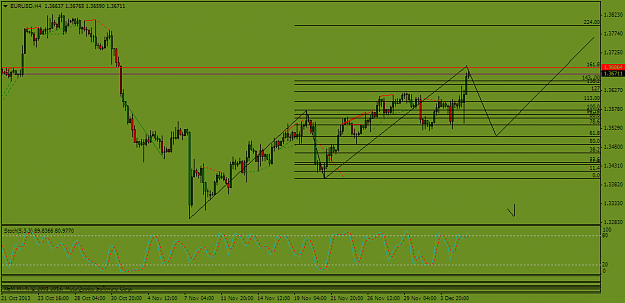
EU is near 161.8 extension of last retraces and I expect a fall to 1.3510 level from there. It can happen before NFP tomorrow. Bad figure in NFP may form possible three drive pattern. The way EU is going up is bearish so I expect deep correction ...
EURUSD
- fxlover11 replied Dec 5, 2013
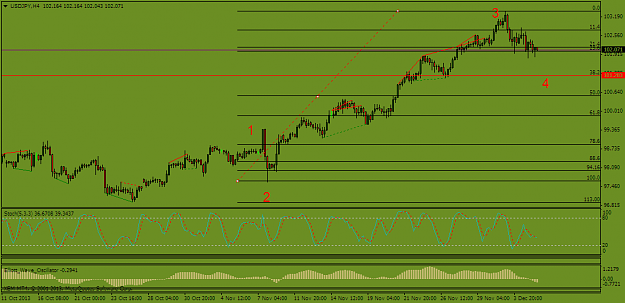
101.20-30 area may be a good buy area if that count proves valid. image
USD/JPY Discussion
- fxlover11 replied Dec 4, 2013
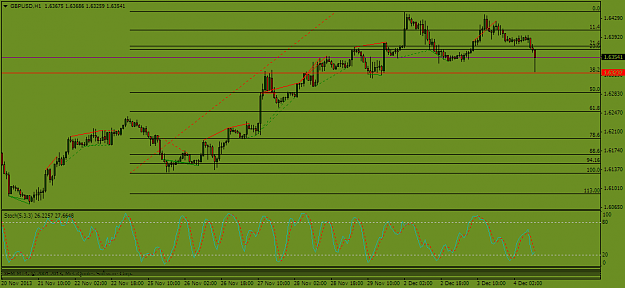
If 1.6323 hold then next may be a new high. image
Cable Update (GBPUSD)
- fxlover11 replied Dec 3, 2013
Nice analysis. In the longer tf 0.80 level is very possible. image
AUD/USD
- fxlover11 replied Dec 3, 2013
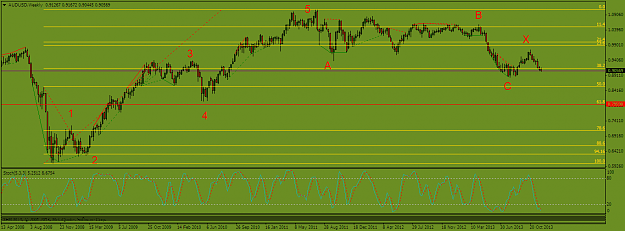
Looks like three drive pattern , may be wave B. Failure of bearish three drive pattern will initiate strong bull other wise strong downside movement is expected. image
NZD/USD
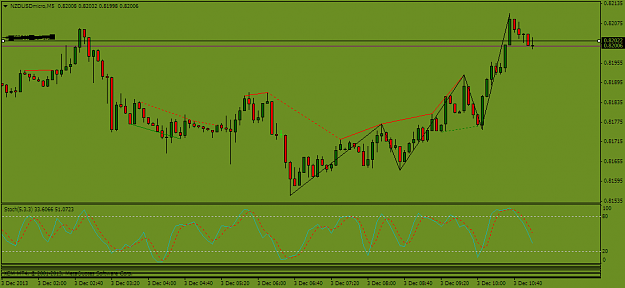
- fxlover11 replied Nov 29, 2013
There is possibility of formation of bearish three drive to retrace the last bull run. But time will tell.... image
EURUSD
- fxlover11 replied Nov 29, 2013
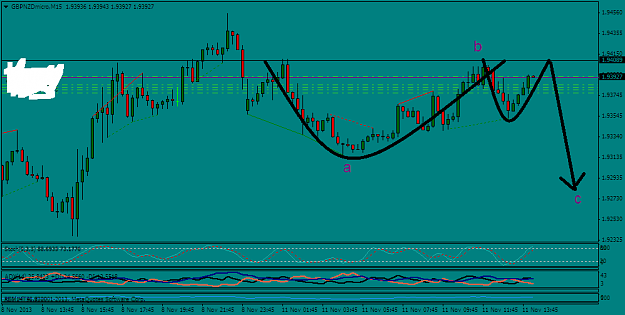
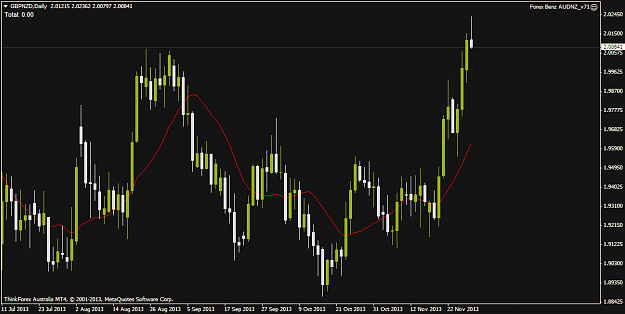
Good shorting opportunity may be in GBP/NZD. Already dropped 150 pips today. image
Cable Update (GBPUSD)
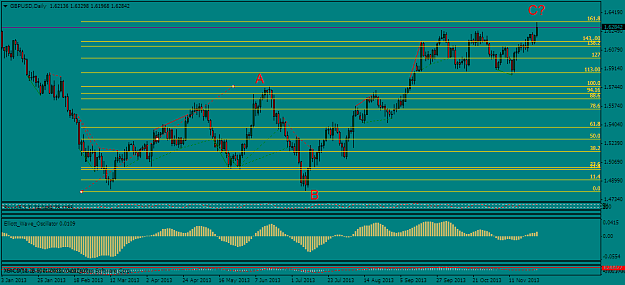
- fxlover11 replied Nov 27, 2013
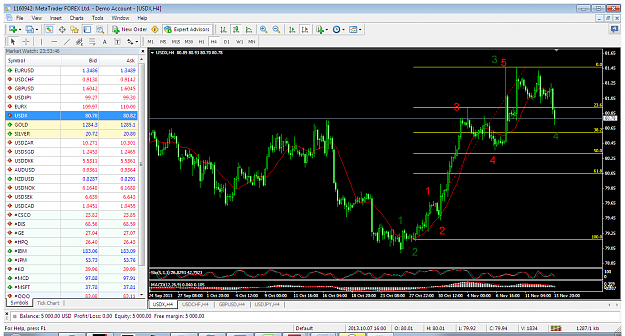
I think it is in the last phase of bull run. If the wave 5 in small tf fail then may this high will persist. Also this high have a fibo importance. But yes may see more extension of the last wave if fundamentals favor GBP. image
Cable Update (GBPUSD)
- fxlover11 replied Nov 15, 2013
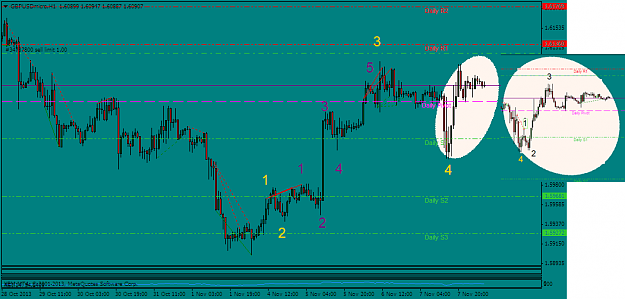
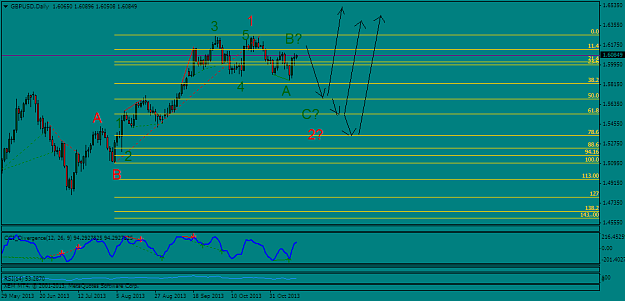
My preferred wave count. GU is in wave B which is correction of wave A . Now the question is how strong this wave B is? BTW at the end of wave B a downward move towards 1.57xx-1.56xx is expected. image
Cable Update (GBPUSD)
- fxlover11 replied Nov 14, 2013
That count demand 1000 pips fall. So if that count proved valid EJ going to fall towars 121.xx-122.xx area. image
EUR/JPY Trading Room
- fxlover11 replied Nov 13, 2013
Last 5 wave impulse that is wave 5 is still due in USDX. The meaning of 5 wave up in USDX is 5 wave down or wave c of cable. I think cable is in wave b and soon wave c will take us to 1.5570-80 area. image
Cable Update (GBPUSD)