- Search Energy EXCH
- 81 Results
-
 eneloop replied Jan 5, 2009
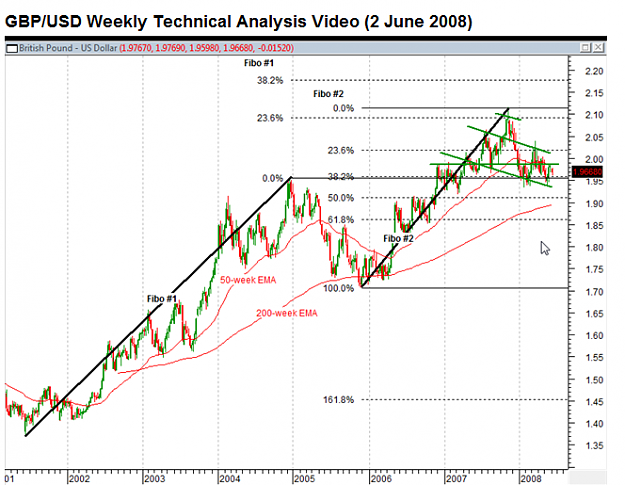
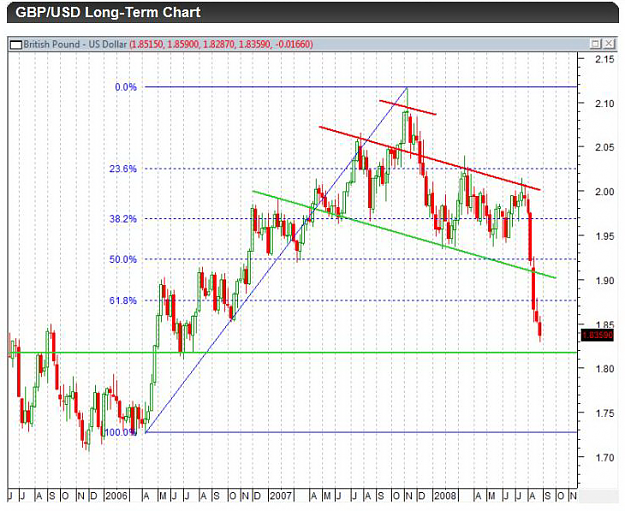
GBPUSD — It's kind of quiet here and in the FX market. May have to wait until London market is opened. Meanwhile just for reference, charts
Malaysia

- eneloop replied Dec 11, 2008
GBPUSD — If you wander why the sudden surge and the sudden drop Here may be an explanation: -- Auto bailout dies in Senate after compromise talks fail. - CNN Breaking News
Malaysia

- eneloop replied Jul 21, 2008
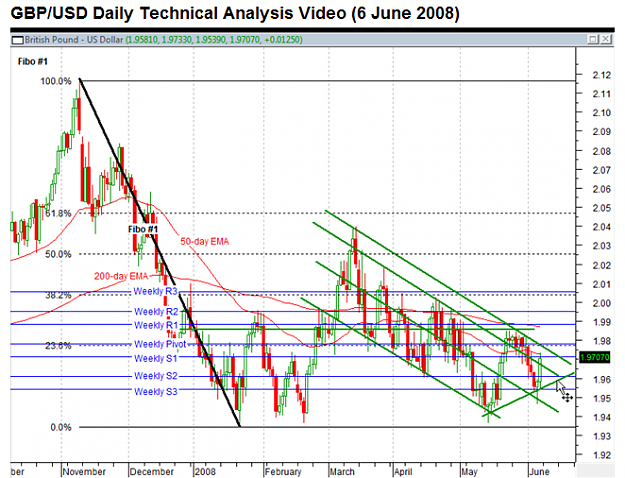
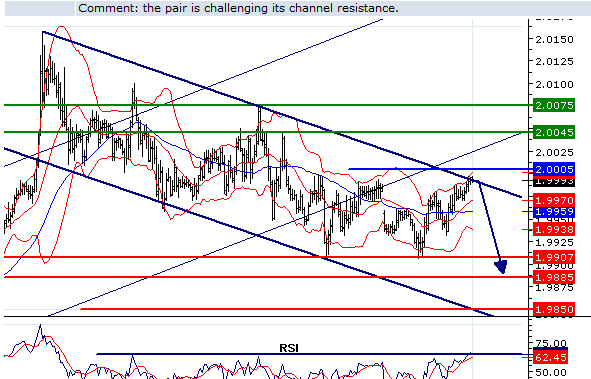
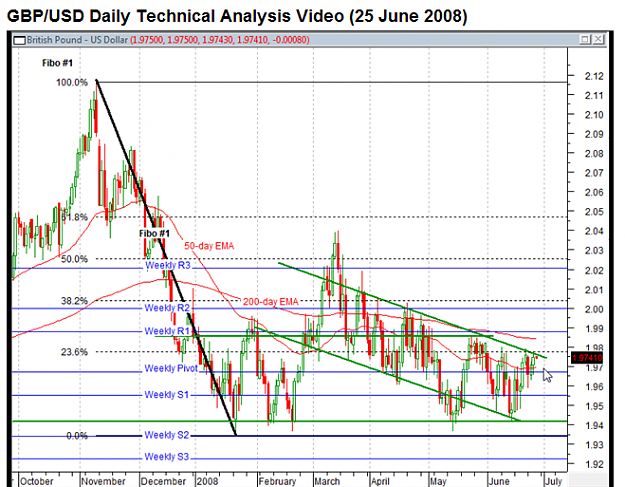
Using Daily Candle stick, GBPUSD looks like still on bullish continuation, unless intervention. Monthly signal is Doji & Hammer continuation = bullish continuation signal. The pair is challenging its channel resistance. So, Trade with caution.
Malaysia
- eneloop replied Jun 25, 2008
The FOMC announced today that it is leaving the federal funds rate unchanged at 2.00%. Most traders were expecting this, but it leaves us with the question, "Now what?"
Malaysia
- eneloop replied Jun 22, 2008
For Shamx — My 501st post: Our local yacht club fishing competition (off shore category) price winners. The heaviest fish is 15kg. Quite a lot of Barukuda
Malaysia

- eneloop replied Jun 19, 2008
Thunder, rain will fall soon. Typhon coming from Philippine. Likely to have power cut, since no position is held, I will call it a night mate!
Malaysia

- eneloop replied Jun 19, 2008
Ha ha, I watched that movie last night. Though most audiences went there for a good laugh, there are actually a lot of moral, wisdom, guidance, belief, faith and fate contained therein. The secret is: Know Thyself! Accept yourself and improve on ...
Malaysia

- eneloop replied Jun 18, 2008
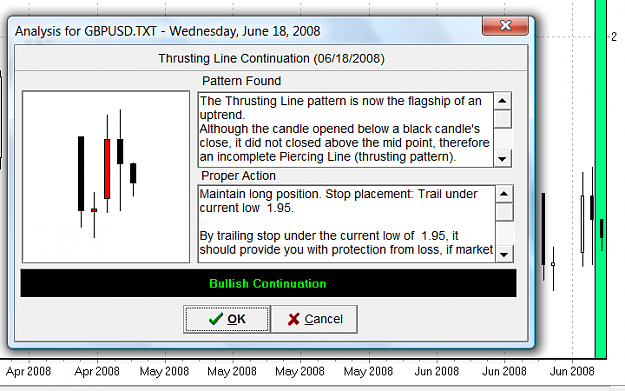
GBPUSD — Also confuse. The CS using current data says: Bullish Continuation, ha ha. It basically is saying: Although the candle opened below a black candle's close, it did not close above the mid point , therefore an incomplete piercing line ...
Malaysia
- eneloop replied Jun 17, 2008
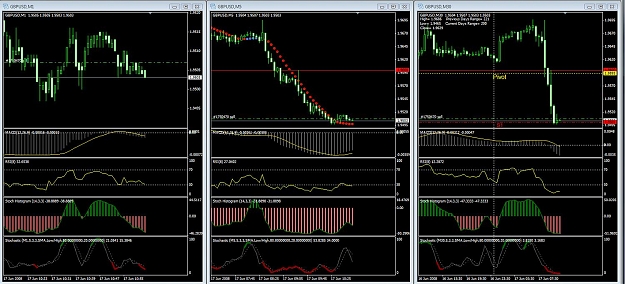
For Zack — Just to illustrate the Momentum using Stoch Histogram indicator. The 3rd in the Indicator windows showing Green if above 0 and red if below 0. So now all M1, M5 and M30 are all red!
Malaysia

- eneloop replied Jun 11, 2008
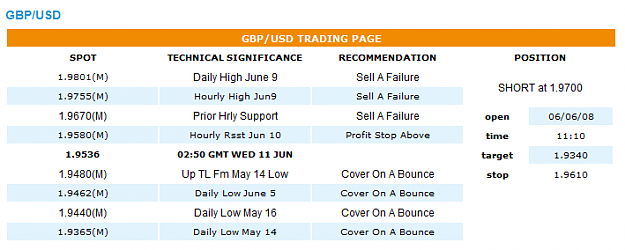
Fresh shorts in play from overnight and we have adjusted the stop now to above hourly resistance from yesterday at 1.9665. The critical level to watch above now becomes 1.9850 with only a break back above ultimately required to delay the bearish ...
Malaysia
- eneloop replied Jun 10, 2008
GBPUSD — I will place a Sell Stop at the weekly S1 and a Buy Limit at 1.96xx.
Malaysia
- eneloop replied Jun 10, 2008
GPBUSD — The pair is now in Bollinger Bands' "No Man Zone". Should not enter position to wait but use P.O. instead. The Resistance, as you have correctly stated is at 1.9600. An intermediate one is considered by some to be at 1.9575 (earlier ...
Malaysia
- eneloop replied Jun 10, 2008
I may do so when: "the proper way to use stochastic is to observe the indicator once it has entered the overbought or oversold zone. Only when the indicator slips back below 80 or moves up above 20 does the trader follow the signal. Stochastics ...
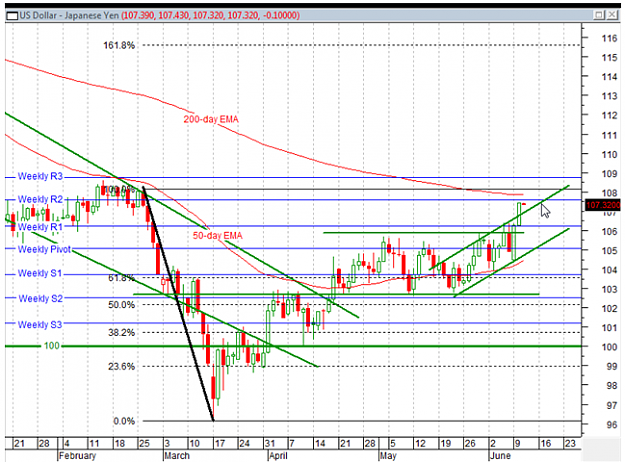
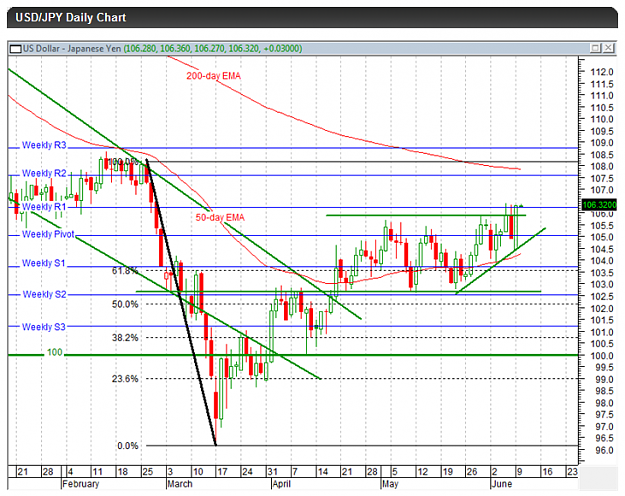
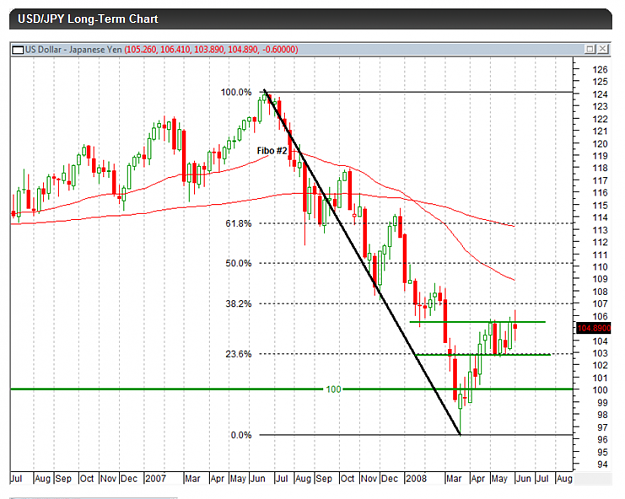
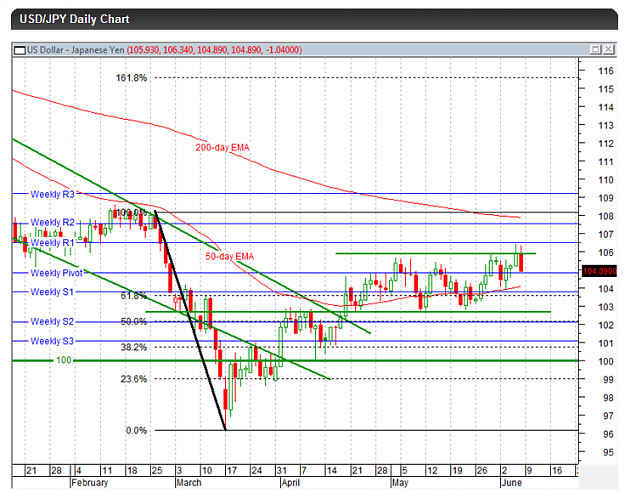
USD/JPY Discussion