- Search Energy EXCH
- 12 Results (1 Thread , 11 Replies )
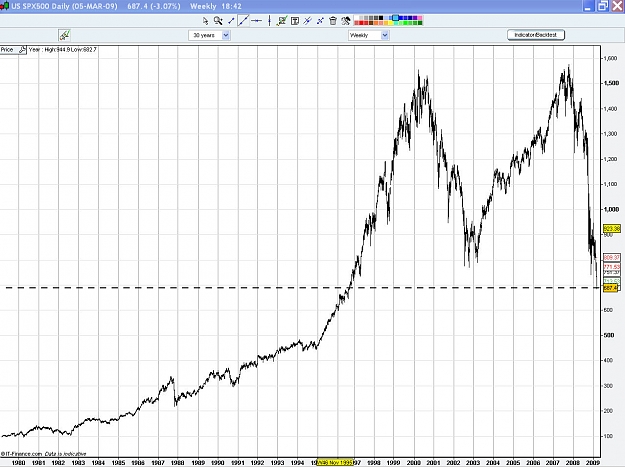
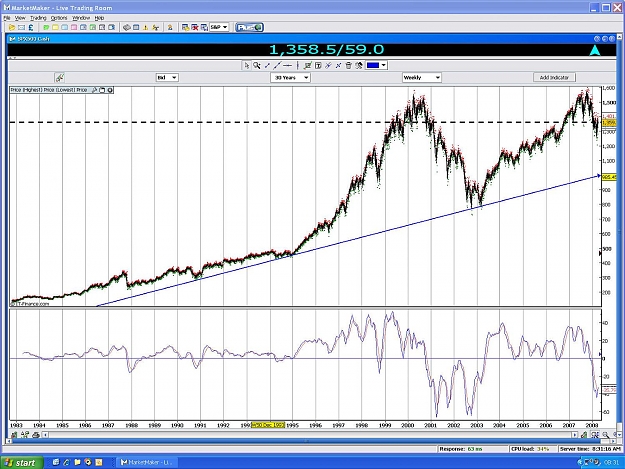
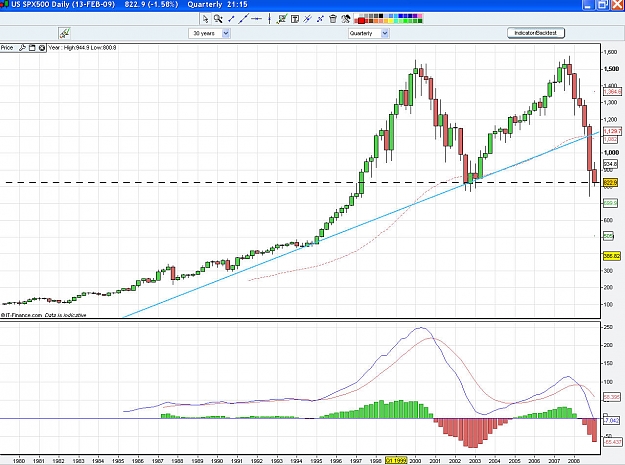
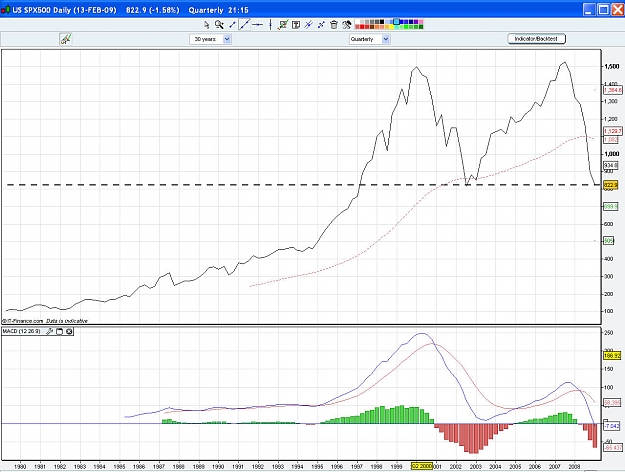
- We are approaching VERY serious times
Please look at 30 year S&P chart !! Now i am a Tech trader and the " M " pattern is usually VERY ...
Just trying to keep the original thread going..............might be a good time to learn Mandarin !!
Look at the BIGGER picture...............looks like a pretty good H&S to me
You know the saying " sell in may and go away " I took this snap last May.................shudda gone shrt then
Pips Cruiser, I do hope so for all our sake's I have put the same chart up using candles...............doesn't look any better
Please look at 30 year S&P chart !! Now i am a Tech trader and the " M " pattern is usually VERY ...
245.5 is 23% fibo AND previous resistance ( now support) needs something now ( new house sales?? )to move it waiting again
OK OK this one is better
OK I will share this just once more Go to the 2hr chart plot 8 and 13 ema's put a standard bolli on it then underneath have standard MACD wait for macd to cross ( forwarning ) then WAIT til you see the 2 ema's cross through the bolli MA trade that ...
Can anyone see a short signal yet ????
OH dear I am not having a good day, this the real chart OOPPS
TRADER 8686 I dont use MT4 just normal charts
Uppy me Thinky